FOR IMMEDIATE PUBLICATION
JANUARY TO MARCH 2011 STATISTICAL REPORT
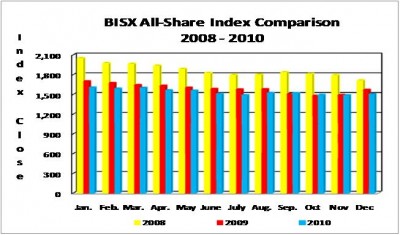
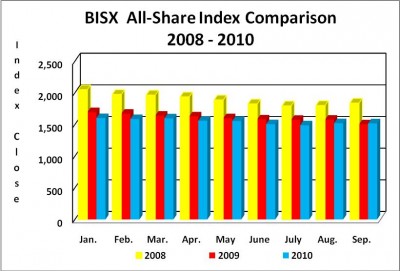
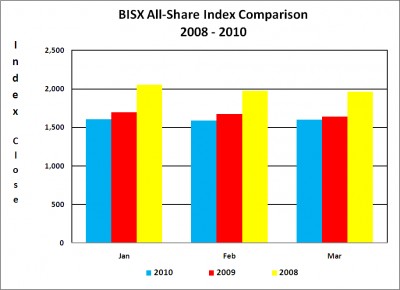
BISX is pleased to announce its BISX All-Share Index and trading statistics for the three month period ending March 31, 2011 with comparison to the same period of 2010.
BISX ALL SHARE INDEX
For the three month period ending March 31, 2011 the BISX All-Share Index closed at 1,473.41. This represents a year to date decrease of 26.10 or 1.74%. For the period ending March 31, 2010, the BISX All Share Index closed at 1,596.62, which represented a year to date decrease of 31.24 or 2.00%. The BISX All-Share Index is a market capitalization weighted index comprised of all primary market listings excluding debt securities.
As at March 31, 2011 the market was comprised of 23 primary market listings with a market capitalization of $2.854 Billion. The primary market securities traded over BISX include 18 common share listings, 1 preference share listing and 4 tranches of debt.
COMPARISON OF BISX ALL SHARE INDEX TO INTERNATIONAL INDICES
Over the 3 month period January 1 to March 31, 2011, some international equity markets have experienced increases as indicated by the chart below:
Closing Date
MSCI Emerging Market Index
S&P 500 Index
FTSE 100 Index
BISX All Share Index
31-Dec-10
1,151.38
1,257.64
5,899.90
1,499.51
31-Mar-11
1,170.87
1,325.83
5,908.80
1,473.41
Percentage Change (+/-) 1.69%
5.42%
0.15%
-1.74%
TRADING VOLUMES AND VALUES
Trading volume for the three month period ending March 31, 2011 was 642,314 shares for a value of $3,258,791.69. By comparison, trading volume for the three month period ending March 31, 2010 was 6,673,918 shares for a value of $85,392,191.13. The trading volume for the three month period ending March 31, 2010 includes a 5,954,600 share trade in Cable Bahamas Limited (CAB) for a value of approximately $80,000,000 which was carried out in January 2010. Removing this transaction from the Q1, 2010 statistics results in 719,318 shares trading for a value of $5,421,913.13.
AVERAGE DAILY VOLUME AND VALUE
During the 3 month period ended March 31, 2011, the average volume per trading day was 9,945 shares for an average value of $50,577. March saw the largest average daily trading volume and value during the 3 month period ending March 31, 2011, with 15,208 shares trading for $74,728. By comparison, the three month period ended March 31, 2010, excluding the CAB transaction, the average daily trading volume was 10,924 shares which equaled an average daily trading value of $84,460. During this three month period; March 2010 saw the highest average daily trading volume and value with 18,226 shares and $90,706 trading, respectively.
Month
Avg. volume / trading day (2011) Avg. volume / trading day (2010) Avg. value / trading day (2011) Avg. value / trading day (2010)
January 6,505
9,182
$29,299 $82,195
February
8,122
5,365
$47,704 $80,480
March
15,208
18,226
$74,728 $90,706
Average for quarter
9,945
10,924
$50,577 $84,460
SHARE VOLUME AND VALUE LEADERS (THREE MONTH PERIOD) The top five share volume leaders on BISX for the three month period ending March 31, 2011 with their contribution to total traded volume displayed as a percentage were:
SYMBOL
TRADE VOLUME
% OF VOLUME
CBL
207,566 32.3%
CHL
113,490 17.7%
AML
90,764
14.1%
BOB
62,844
9.8%
FCL
47,180
7.3%
The top five share value leaders for the three month period ending March 31, 2011 with their contribution to total traded value displayed as a percentage were:
SYMBOL
TRADE VALUE % OF TRADE VALUE
CBL
$ 1,417,619.66 43.5%
BOB
$ 314,315.67
9.6%
CHL
$ 287,376.00
8.8%
FBB15
$ 274,000.00
8.4%
FCL
$ 261,163.40
8.0%
For Additional Information Contact:
Holland Grant
BISX Listing Manager
Tel: 242-323-2330
Fax: 242-323-2320
Email: info@bisxbahamas.com