BISX Q1 Statistical Report 2019
FOR IMMEDIATE PUBLICATION
JANUARY TO MARCH 2019 STATISTICAL REPORT
BISX is pleased to announce its BISX All-Share Index and trading statistics for the three-month period ending March 29, 2019 with comparison to the same period of 2018.
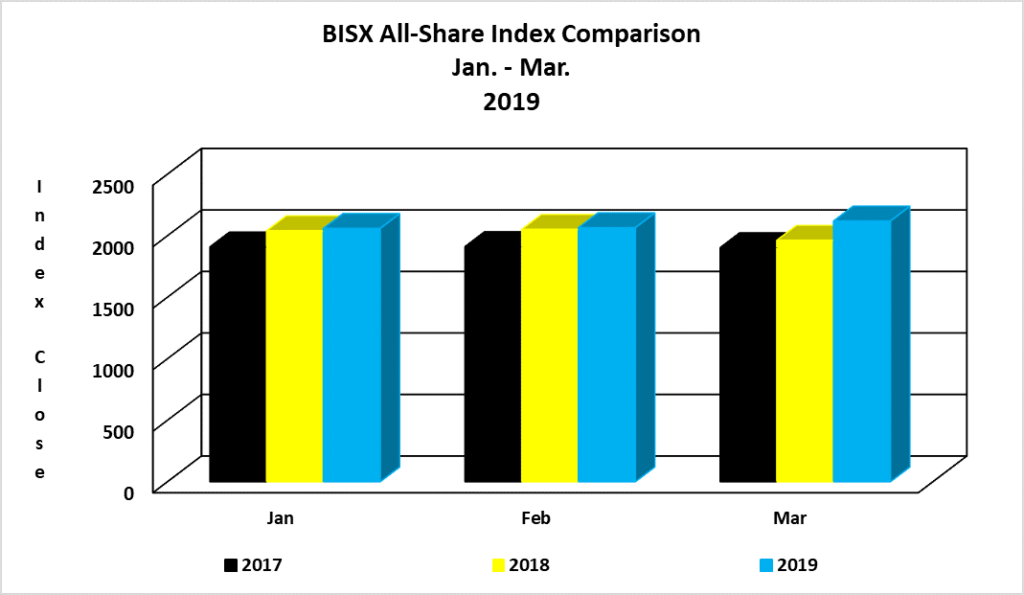
BISX ALL SHARE INDEX
For the three-month period ending March 29, 2019 the BISX All-Share Index closed at 2119.29. This represents a year to date increase of 9.88 or 0.47%. By comparison for the three-month period ending March 29, 2018 the BISX All-Share Index closed at 1,962.11. That was a year to date decrease of -101.46 or -4.92%. The BISX All-Share Index is a market capitalization weighted index comprised of all primary market listings excluding debt securities.
As at March 29, 2018 the market was comprised of 19 ordinary shares with a market capitalization of $4.85 Billion. In addition, there were 13 preference shares with a market capitalization of $327 million and 13 bonds with a face value of $513 Million.
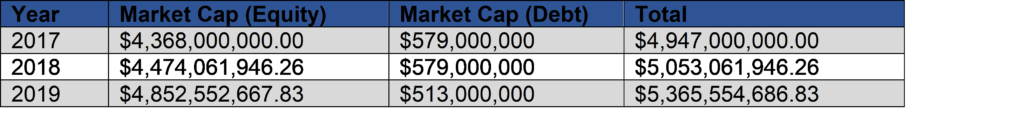
MARKET CAPITAL
Over the 3-year period 2017 to 2019, the market value of all securities listed on BISX has shown an increase, during the as indicated by the chart below:
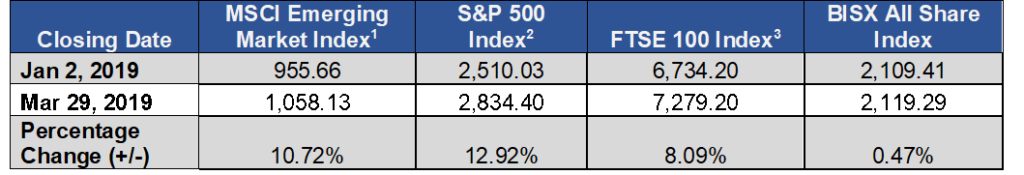
COMPARISON OF BISX ALL SHARE INDEX TO INTERNATIONAL INDICES
Over the three-month period January 2 to March 29, 2019, some international equity markets have experienced increases as indicated by the chart below:
TOTAL TRADES BY SECURITY CLASS
For the three-month period ending March 29, 2019, each type of security produced the totals in the chart below.
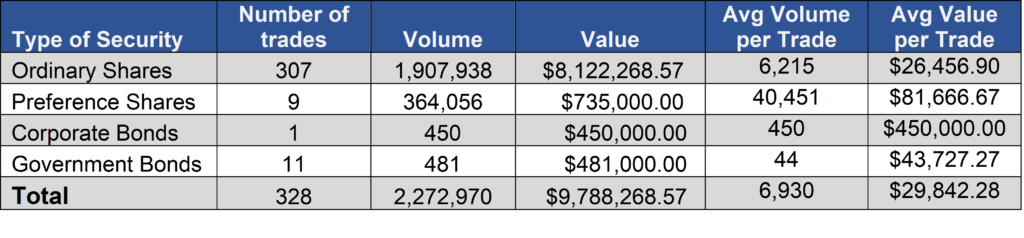
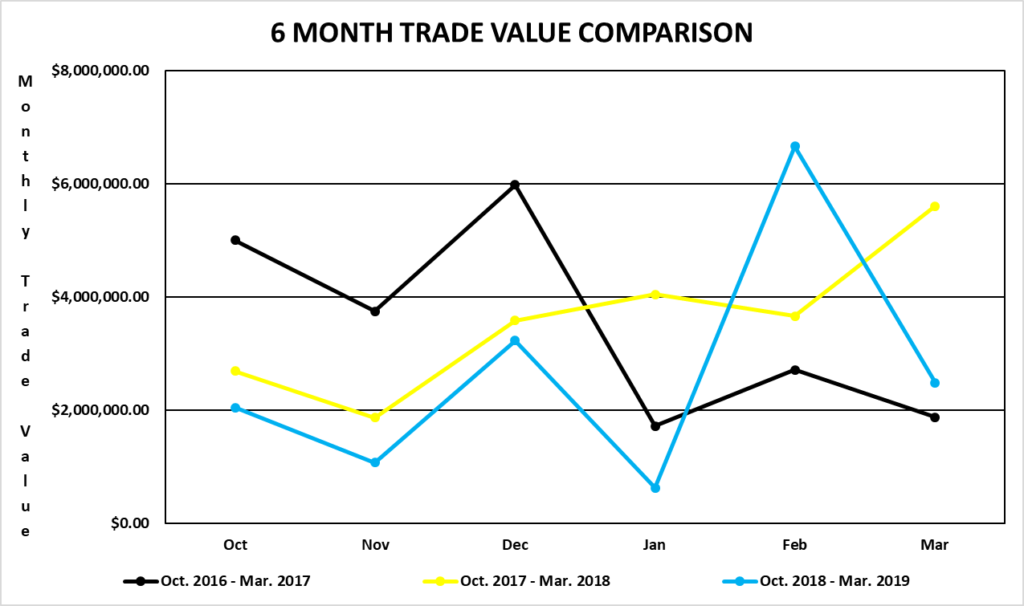
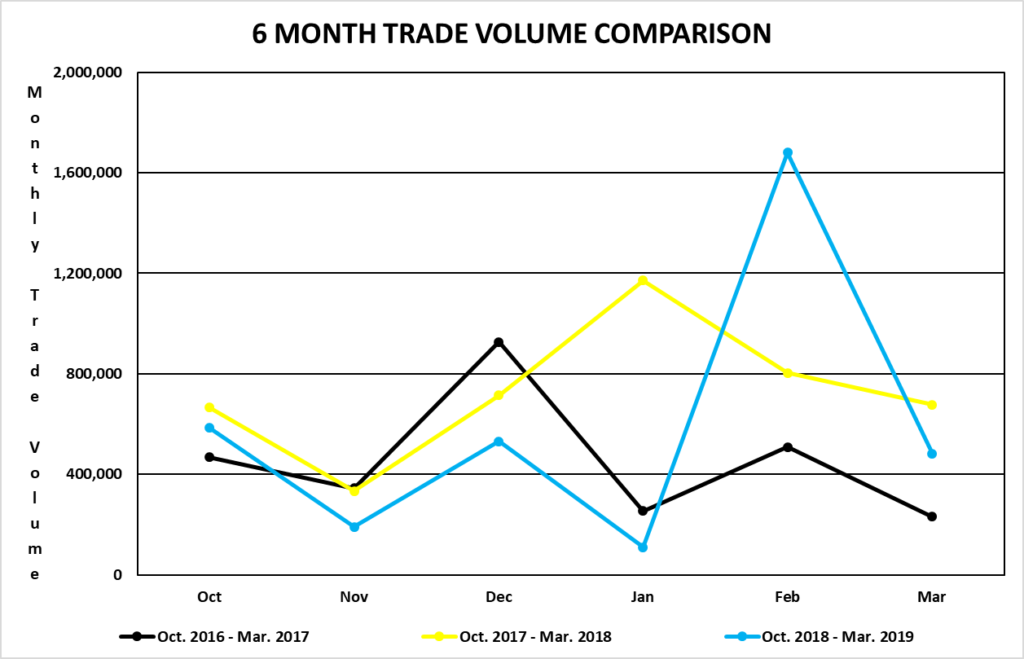
TRADING VOLUMES AND VALUES
Trading volume for the three-month period January 2, 2019 to March 29, 2019 was 2,272,970 shares for a value of $9,788,268.57. By comparison, trading volume for the three-month period January 2, 2018 to March 29, 2018 was 2,651,061 shares for a value of $13,323,691.
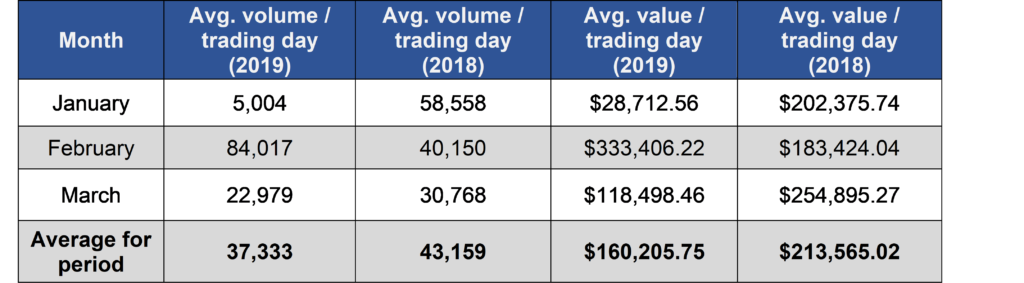
AVERAGE DAILY VOLUME AND VALUE
For the three-month period from January 2, 2019 to March 29, 2019, the average volume per trading day was 37,333 shares for a value of $ 160,205.75. By comparison, for the three-month period from January 2, 2018 to March 29, 2018, the average volume per trading day was 43,159 shares for a value of $213,565.02.
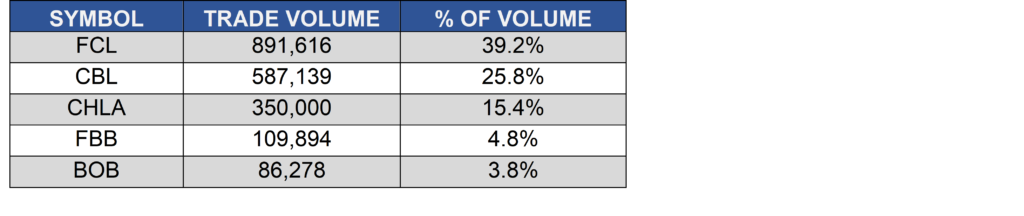
SHARE VOLUME AND VALUE LEADERS (THREE MONTH PERIOD)
The top five share volume leaders on BISX for the three-month period January 2, 2019 to March 29, 2019 with their contribution to total traded volume displayed as a percentage were:
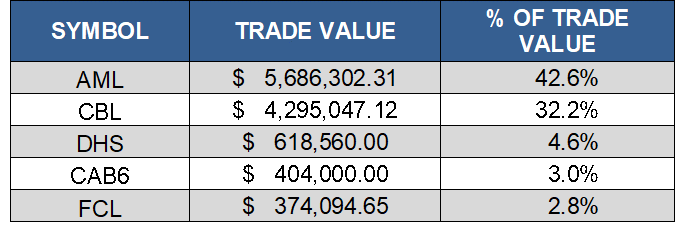
The top five share value leaders for the three-month period January 2, 2019 to March 29, 2019 with their contribution to total traded value displayed as a percentage were:
BISX PUBLISHES PROPOSED RULES AND FEE SCHEDULE AMMENDMENTS
FOR IMMEDIATE PUBLICATION 13 MAY 2019Rule Proposals 13 May 2019 v2.0
The Bahamas International Securities Exchange (BISX) is pleased to announce an improvement to the BISX Website with the addition of a new section dedicated to Proposed Rule and Fee Amendments. The new section is located under the Market Regulation menu item on the BISX Website and provides a location where BISX can introduce and publish proposed amendments to Rules and Fee Schedules.
With the addition of this new section, BISX is also publishing several proposed rule amendments for public review and consultation for a period of 30 days. After this time, the rules including any amendments based on the public feedback will be provided to the Securities Commission of The Bahamas for review and final approval.
Speaking of the rule and fee amendment publications, BISX CEO Keith Davies noted: “We wanted to post these items for review and consideration by all stakeholders in our market, and give them an opportunity to comment on the proposed rule and fee amendments. This type of interaction is invaluable to BISX as it allows us to receive direct communications from interested persons. The aim going forward is to be more aggressive with amending our rules to ensure that we adhere and respond to changing market conditions and keep pace with regulatory best practices. It is our intention to use our website to ensure that Issuers, Brokers, investors and the general public are completely involved in this process. I look forward to the feedback that we will receive from the Bahamian capital markets.”
The proposed rule changes were focused on the following sections:
- Section 4: Trading Rules,
- Section 6: Listing Rules,
- Section 7: Issuers Continuing Obligations, and
- The BISX Fee Schedule.
The proposed rule and fee amendments can be found at: https://bisxbahamas.com/proposed-rule-and-fee-amendments/
Comments can be emailed to: rules@bisxbahamas.com
For Additional Information Contact:
Elude Michel-Sturrup, BISX
Tel: 242-323-2330
Fax: 242-323-2320
Email: info@bisxbahamas.com
Attachments
BISX Q4 Statistical Report 2018
FOR IMMEDIATE PUBLICATION
JANUARY TO DECEMBER 2018 STATISTICAL REPORT
BISX is pleased to announce its BISX All-Share Index and trading statistics for the twelve-month period ending December 31, 2018 with comparison to the same period of 2017.
BISX ALL SHARE INDEX
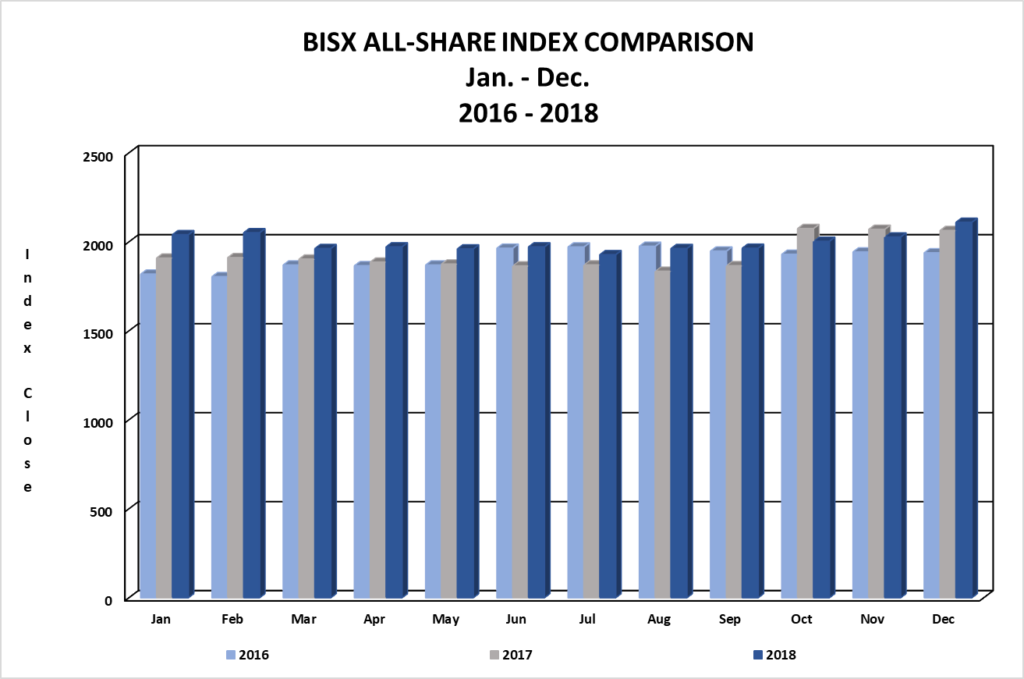
For the twelve-month period ending December 31, 2018 the BISX All-Share Index closed at 2,109.45. This represents a year to date increase of 45.88 or 2.22%. By comparison for the twelve-month period ending December 29, 2017 the BISX All-Share Index closed at 2,063.57. That increase was a year to date increase of 125.36 or 6.47%. The BISX All-Share Index is a market capitalization weighted index comprised of all primary market listings excluding debt securities.
As at December 31, 2018 the market was comprised of 19 ordinary shares with a market capitalization of $4.48 Billion. In addition, there were 13 preference shares with a market capitalization of $327 Million and 19 bonds with a face value of $579 Million.
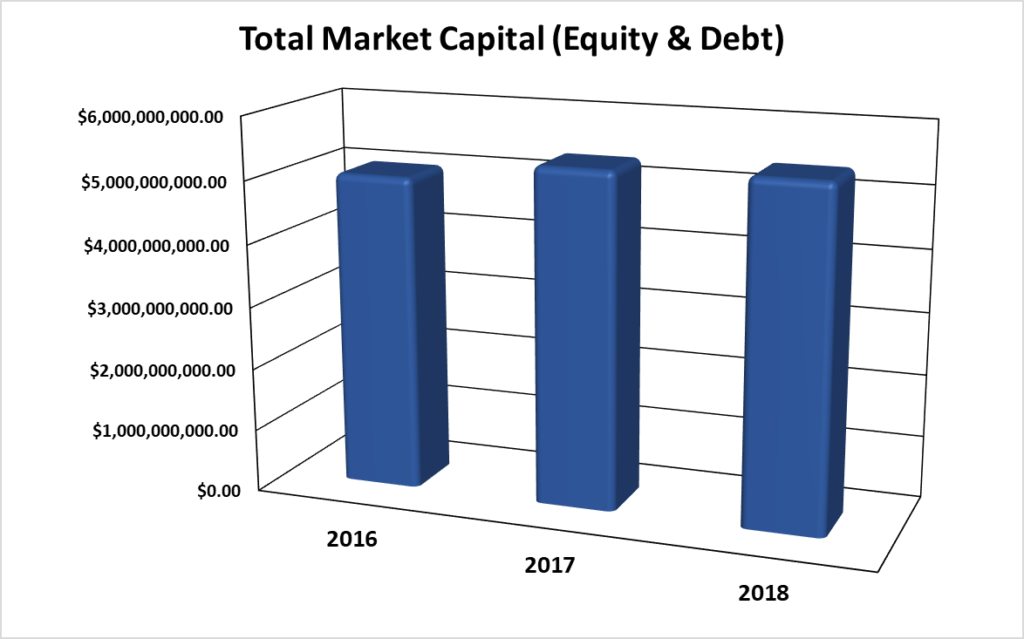
MARKET CAPITAL
Over the 3-year period 2016 to 2018, the market value of all securities listed on BISX has shown an increase from 2016 to 2017 and then an increase from 2017 to 2018 as indicated by the chart below:
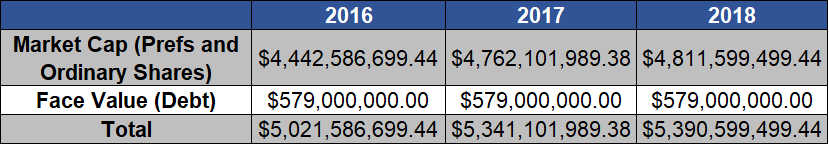
Total Market Capital by Year – (a numerical representation of the chart above)
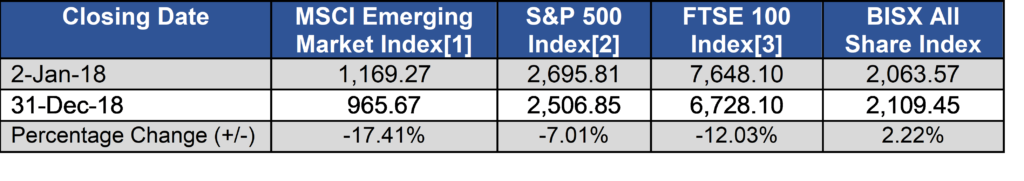
COMPARISON OF BISX ALL SHARE INDEX TO INTERNATIONAL INDICES
Over the 12-month period January 2 to December 31, 2018, some international equity markets have experienced decreases as indicated by the chart below:
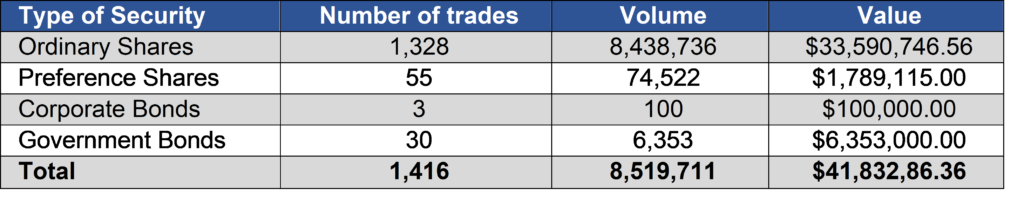
TOTAL TRADES BY SECURITY CLASS
For the twelve-month period ending December 31, 2018, each type of security produced the totals in the chart below.
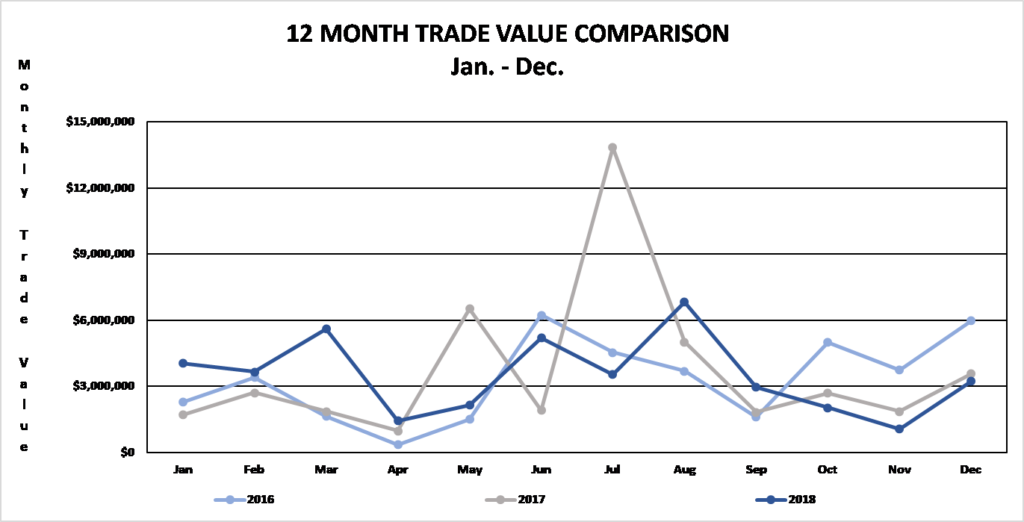
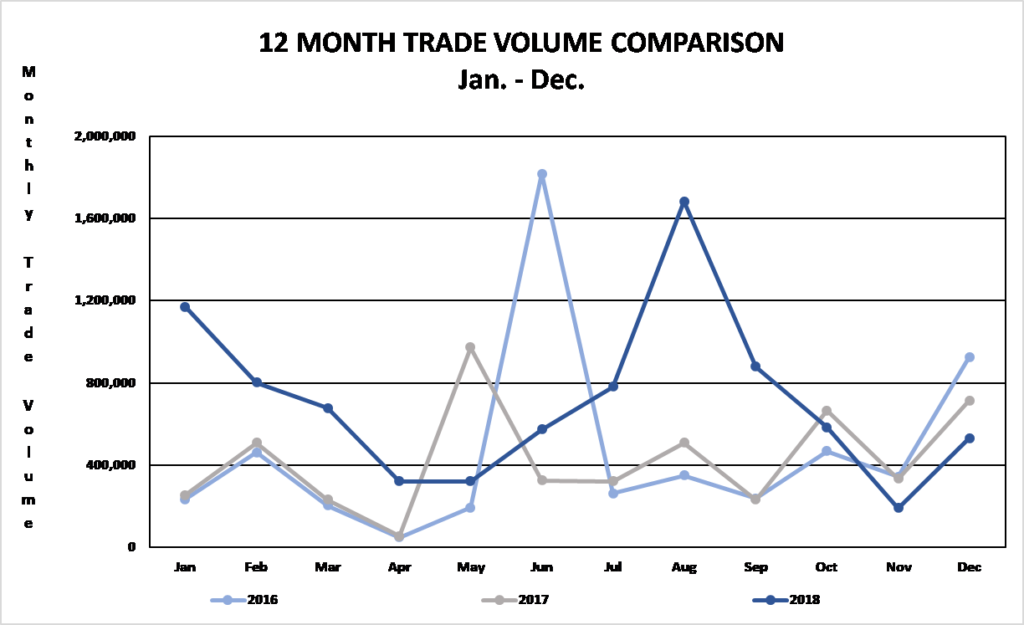
TRADING VOLUMES AND VALUES
Trading volume for the twelve-month period January 2, 2018 to December 31, 2018 was 8,519,711 shares for a value of $ 41,832,862.36. Trading volume for the twelve-month period January 1, 2017 to December 29, 2017 was 5,128,595 shares for a value of $44,596,767.
Trading volume for the three-month period October 1 to December 31, 2018 was 1,308,443 shares for a value of $ 6,352,247.50. By comparison, for the three-month period from October 1 to December 29, 2017 was 1,714,335 shares for a value of $8,151,746.
AVERAGE DAILY VOLUME AND VALUE
For the twelve-month period ending December 31, 2018, the average daily trading volume was 34,150
shares which resulted in an average daily trading value of $167,596.14. By comparison for the twelve-month period December 29, 2017 the average daily trading volume was 20,399 shares for an average value of $178,989.46.
During the three-month period from October 1, 2018 to December 31, 2018, the average volume per trading day was 21,097 shares for a value of $103,981.84. By comparison, for the three-month period from October 1, 2017 to December 29, 2017, the average volume per trading day was 28,165 shares for an average value of $134,035.34.

SHARE VOLUME AND VALUE LEADERS (TWELVE MONTH PERIOD)
The top five share volume leaders on BISX for the twelve-month period January 2, 2018 to December 31, 2018 with their contribution to total traded volume displayed as a percentage were:

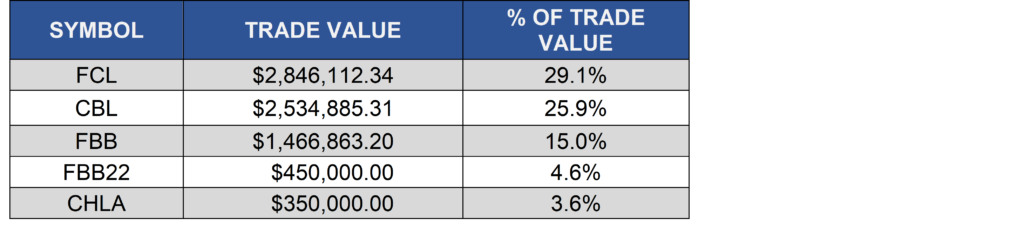
The top five share value leaders for the twelve-month period January 2, 2018 to December 31, 2018 with their contribution to total traded value displayed as a percentage were:
SHARE VOLUME AND VALUE LEADERS (THREE MONTH PERIOD)
The top five share volume leaders on BISX for the three-month period October 1, 2018 to December 31, 2018 with their contribution to total traded volume displayed as a percentage were:
The top five share value leaders for the three-month period October 1, 2018 to December 31, 2018 with their contribution to total traded value displayed as a percentage were:
BISX Q3 Statistical Report 2018
FOR IMMEDIATE PUBLICATION
JANUARY TO SEPTEMBER 2018 STATISTICAL REPORT
BISX is pleased to announce its BISX All-Share Index and trading statistics for the nine-month period ending September 28, 2018 with comparison to the same period of 2017.
BISX ALL SHARE INDEX
For the nine-month period ending September 28, 2018 the BISX All-Share Index closed at 1,964.04 this represented a year to date decrease of 99.53 or 4.82%. By comparison for the nine-month period ending September 29, 2017 the BISX All-Share Index closed at 1,865.88 this represented a year to date decrease of 72.33 or 3.73%. The BISX All-Share Index is a market capitalization weighted index comprised of all primary market listings excluding debt securities.
As at September 28, 2018 the market was comprised of 19 ordinary shares with a market capitalization of $4.144 Billion. In addition, there were 13 preference shares with a market capitalization of $327 Million and 19 bonds with a face value of $579 Million.
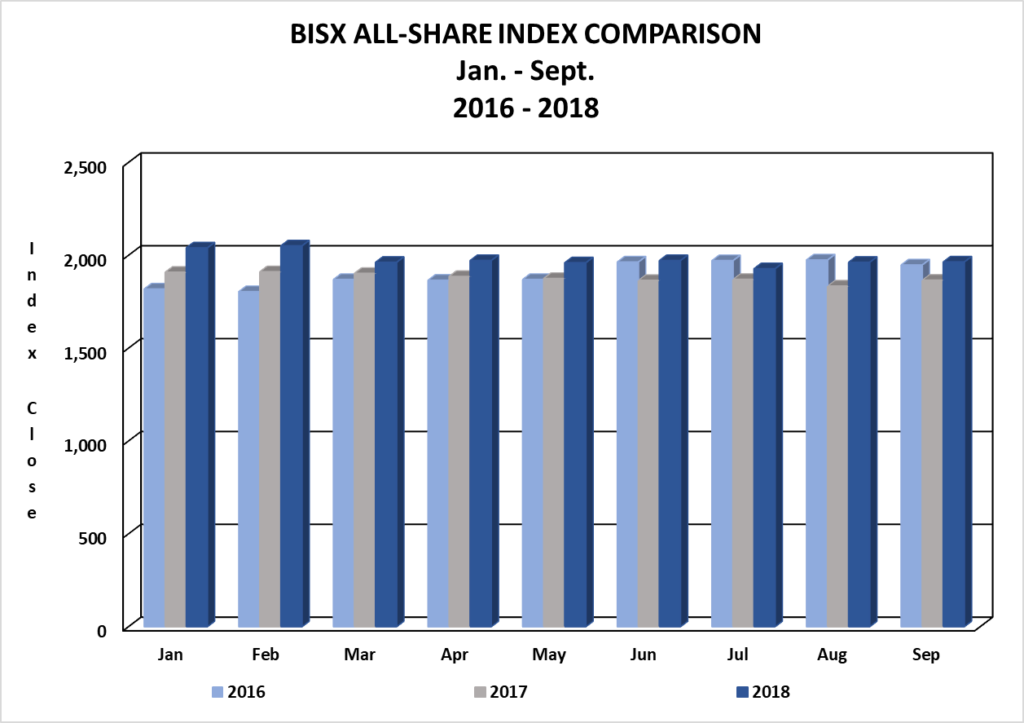
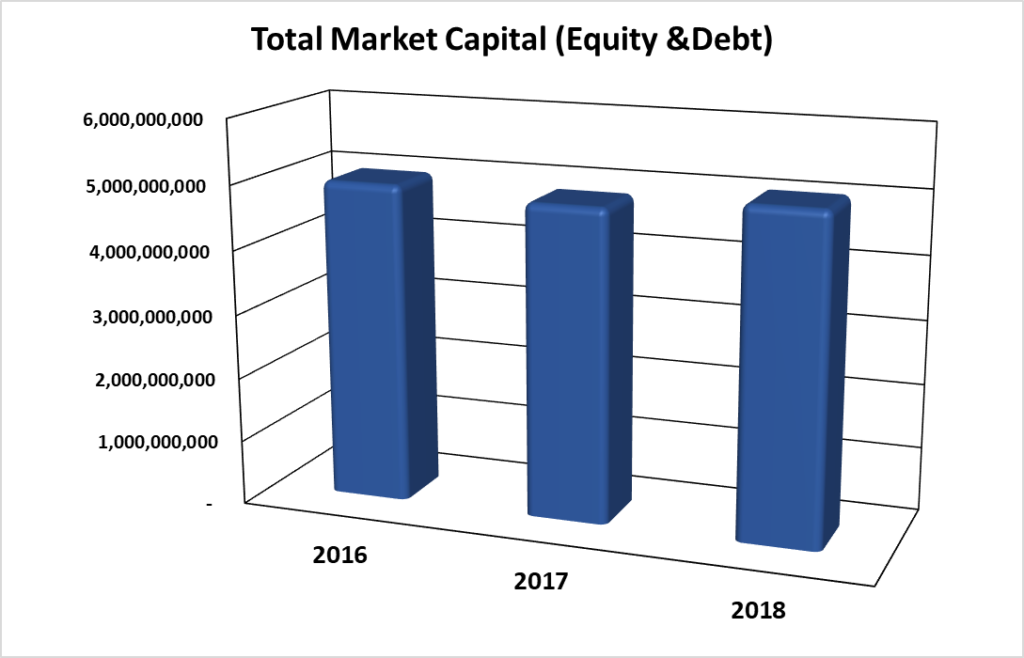
MARKET CAPITAL
Over the 3-year period 2016 to 2018, the market value of all securities listed on BISX has shown a decrease from 2016 – 2017 and an increase from 2017 – 2018, at the beginning of 2018 as indicated by the chart below:
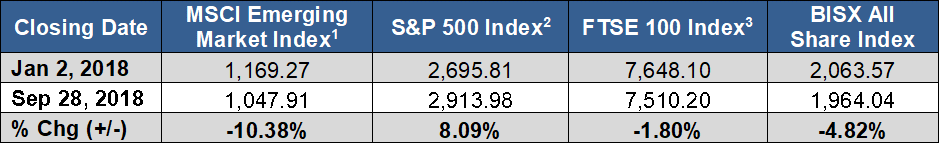
COMPARISON OF BISX ALL SHARE INDEX TO INTERNATIONAL INDICES
Over the 9-month period January 2 to September 28, 2018, international equity markets have experienced mixed performances as indicated by the chart below:
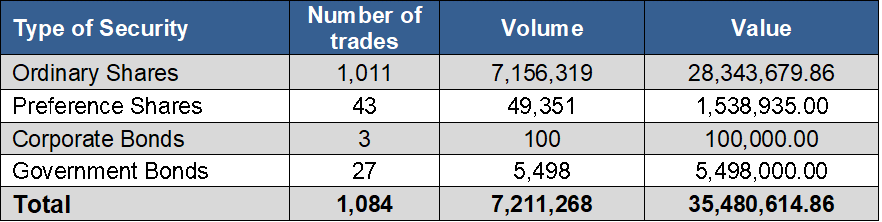
TOTAL TRADES BY SECURITY CLASS
For the nine-month period ending September 28, 2018, each type of security produced the totals in the chart below.
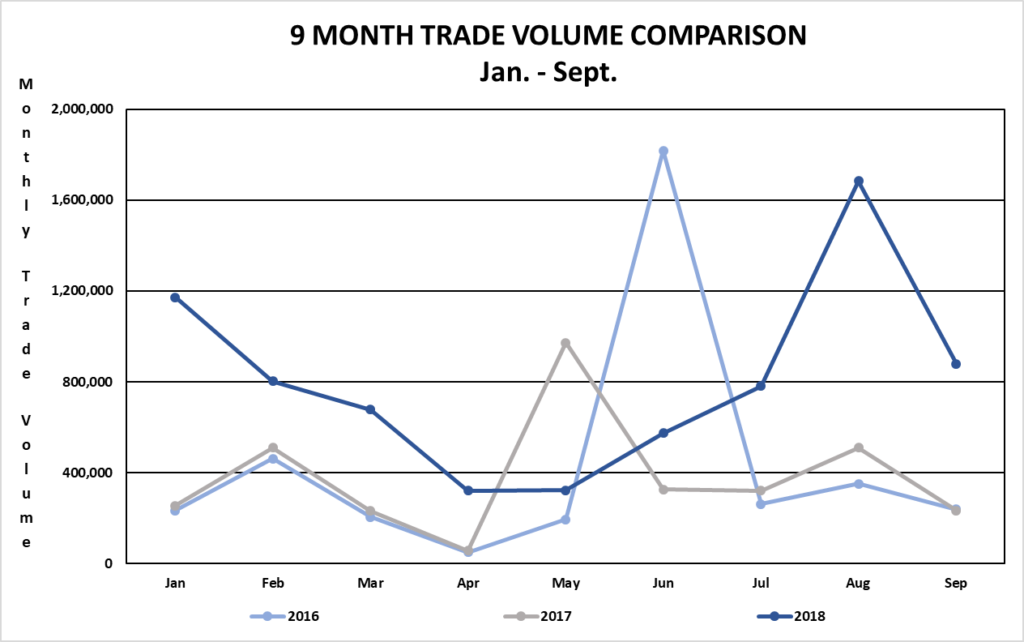
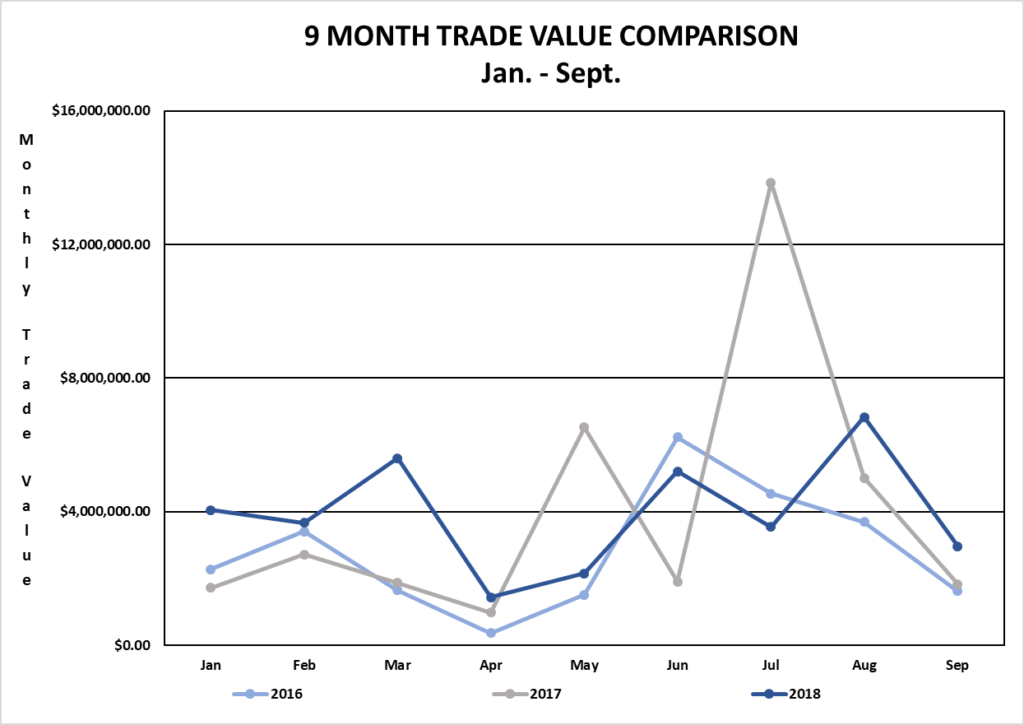
TRADING VOLUMES AND VALUES
Trading volume for the nine-month period January 2, 2018 to September 28, 2018 was 7,211,268 shares for a value of $35,480,614.86. By comparison, trading volume for the nine-month period January 1, 2017 to September 29, 2017 was 3,414,260 shares for a value of $36,445,020.43.
Trading volume for the three-month period July 1, 2018 to September 28, 2018 was 3,343,087 shares for a value of $13,346,815.61. By comparison, trading volume for the three-month period July 1, 2017 to September 29, 2017 was 1,063,957 shares for a value of $20,708,119.53.
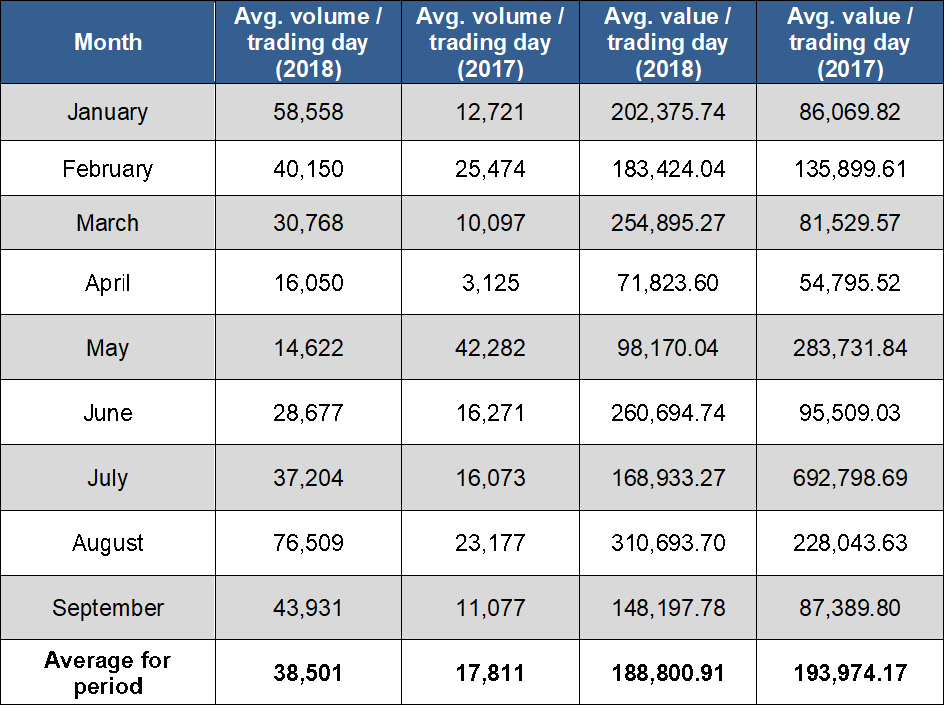
AVERAGE DAILY VOLUME AND VALUE
For the nine-month period from January 2, 2018 to September 28, 2018, the average volume per trading day was 38,501 shares for a value of $188,800.91. By comparison, for the nine-month period from January 1, 2017 to September 29, 2017, the average volume per trading day was 17,811 shares for an average value of $193,974.17.
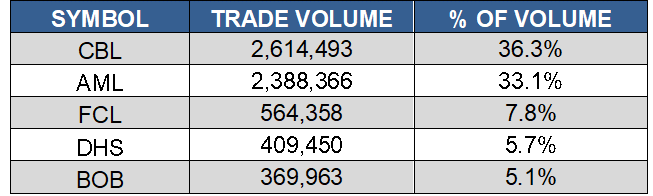
SHARE VOLUME AND VALUE LEADERS (NINE MONTH PERIOD)
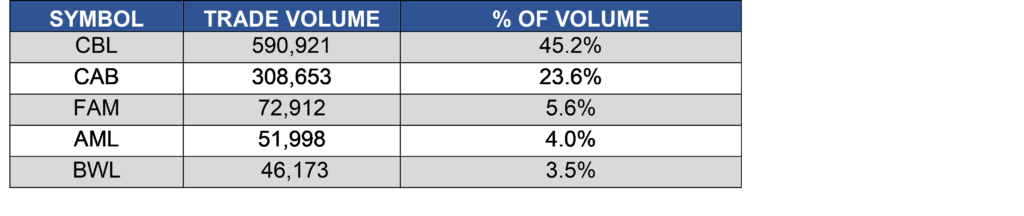
The top five share volume leaders on BISX for the nine-month period January 2, 2018 to September 28, 2018 with their contribution to total traded volume displayed as a percentage were:
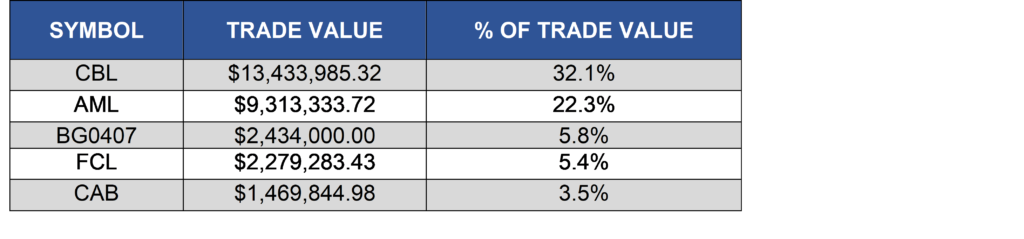
The top five share value leaders for the nine-month period January 2, 2018 to September 28, 2018 with their contribution to total traded value displayed as a percentage were:

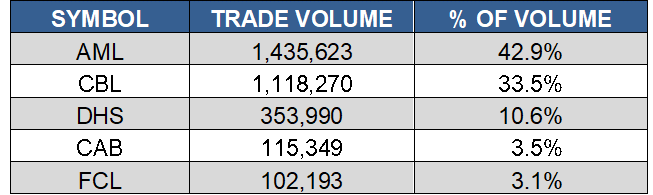
SHARE VOLUME AND VALUE LEADERS (THREE MONTH PERIOD)
The top five share volume leaders on BISX for the three-month period July 1, 2018 to September 28, 2018 with their contribution to total traded volume displayed as a percentage were:
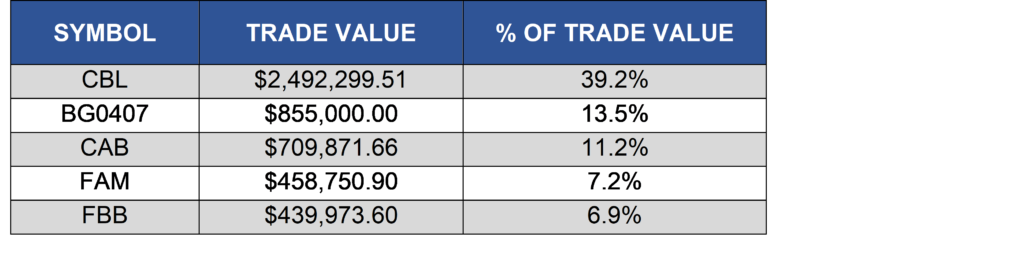
The top five share value leaders for the three-month period July 1, 2018 to September 28, 2018 with their contribution to total traded value displayed as a percentage were:
- « Previous Page
- 1
- …
- 7
- 8
- 9
- 10
- 11
- …
- 25
- Next Page »