FOR IMMEDIATE PUBLICATION
JANUARY TO DECEMBER 2018 STATISTICAL REPORT
BISX is pleased to announce its BISX All-Share Index and trading statistics for the twelve-month period ending December 31, 2018 with comparison to the same period of 2017.
BISX ALL SHARE INDEX
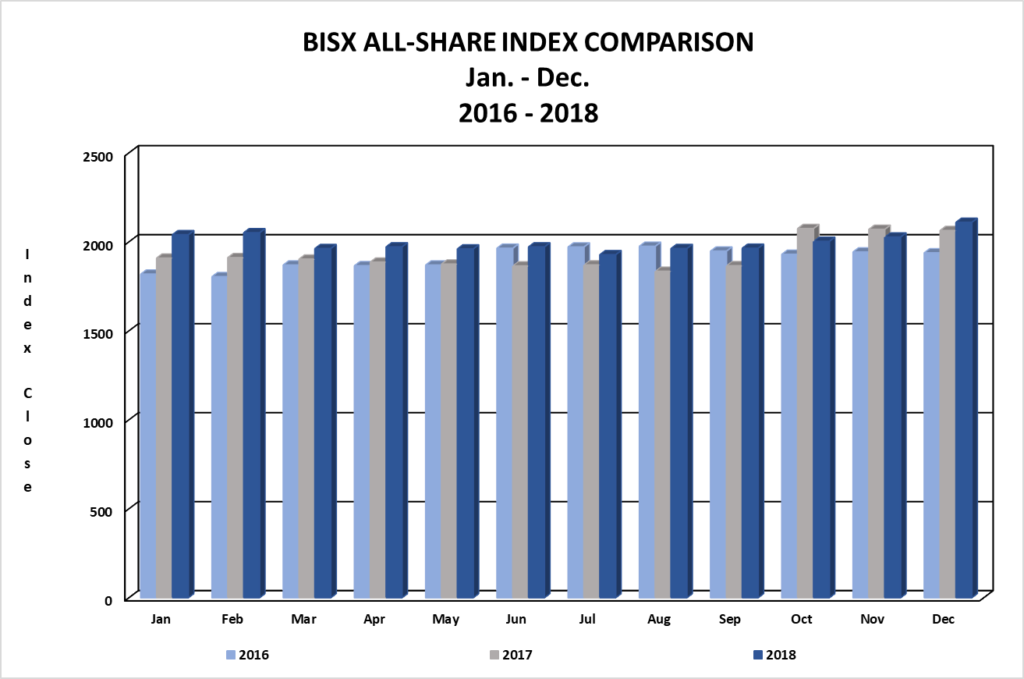
For the twelve-month period ending December 31, 2018 the BISX All-Share Index closed at 2,109.45. This represents a year to date increase of 45.88 or 2.22%. By comparison for the twelve-month period ending December 29, 2017 the BISX All-Share Index closed at 2,063.57. That increase was a year to date increase of 125.36 or 6.47%. The BISX All-Share Index is a market capitalization weighted index comprised of all primary market listings excluding debt securities.
As at December 31, 2018 the market was comprised of 19 ordinary shares with a market capitalization of $4.48 Billion. In addition, there were 13 preference shares with a market capitalization of $327 Million and 19 bonds with a face value of $579 Million.
MARKET CAPITAL
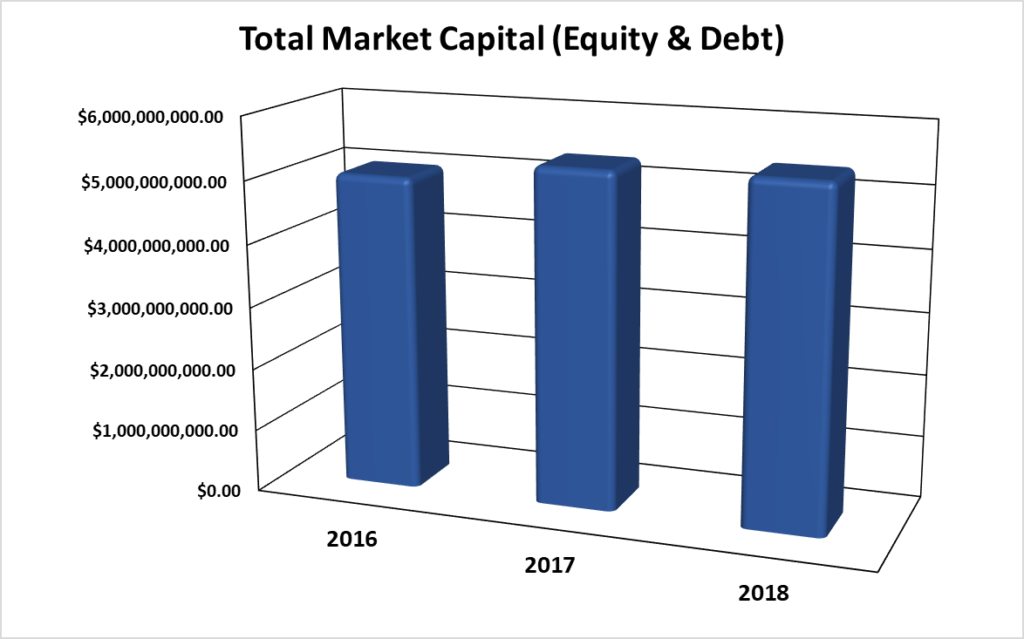
Over the 3-year period 2016 to 2018, the market value of all securities listed on BISX has shown an increase from 2016 to 2017 and then an increase from 2017 to 2018 as indicated by the chart below:
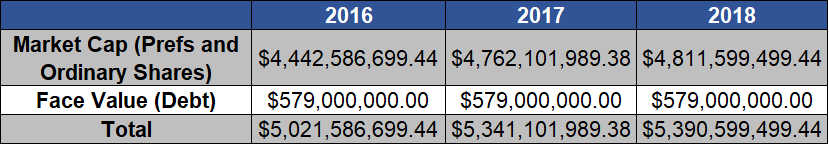
Total Market Capital by Year – (a numerical representation of the chart above)
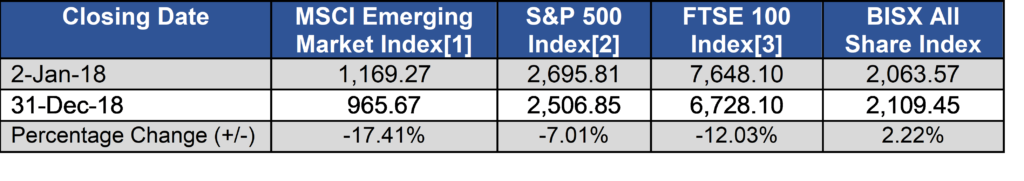
COMPARISON OF BISX ALL SHARE INDEX TO INTERNATIONAL INDICES
Over the 12-month period January 2 to December 31, 2018, some international equity markets have experienced decreases as indicated by the chart below:
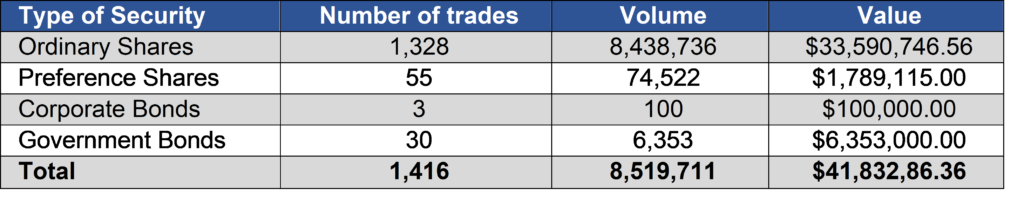
TOTAL TRADES BY SECURITY CLASS
For the twelve-month period ending December 31, 2018, each type of security produced the totals in the chart below.
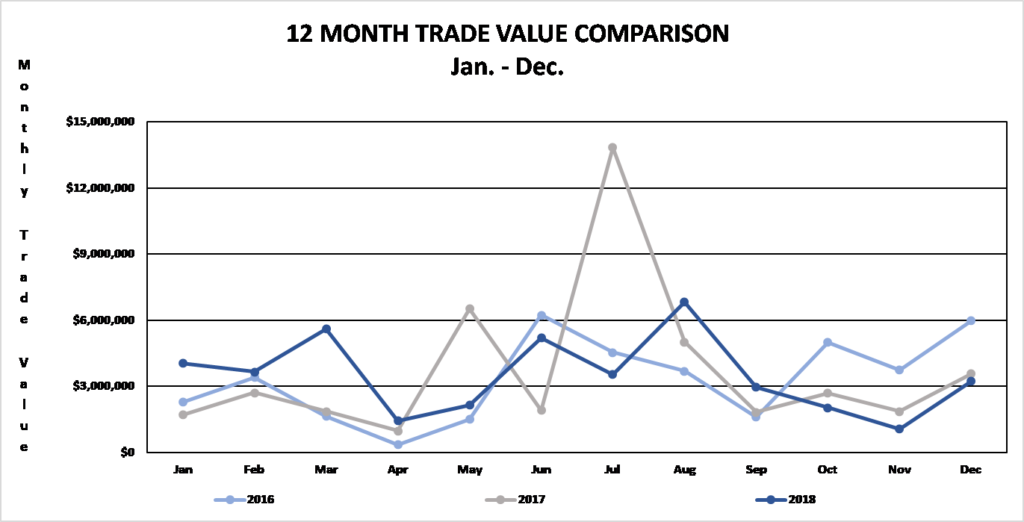
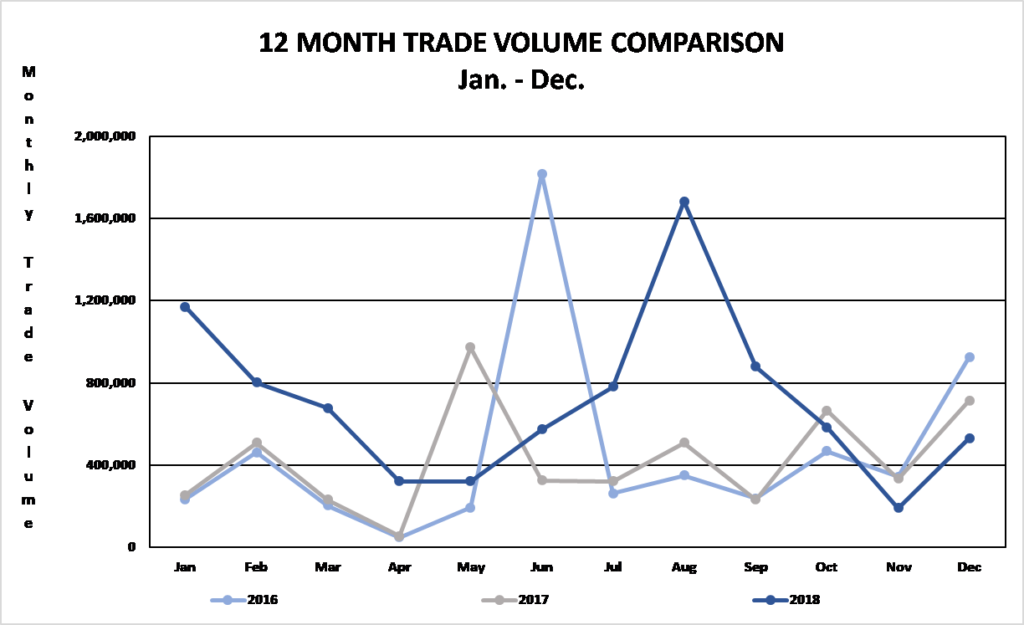
TRADING VOLUMES AND VALUES
Trading volume for the twelve-month period January 2, 2018 to December 31, 2018 was 8,519,711 shares for a value of $ 41,832,862.36. Trading volume for the twelve-month period January 1, 2017 to December 29, 2017 was 5,128,595 shares for a value of $44,596,767.
Trading volume for the three-month period October 1 to December 31, 2018 was 1,308,443 shares for a value of $ 6,352,247.50. By comparison, for the three-month period from October 1 to December 29, 2017 was 1,714,335 shares for a value of $8,151,746.
AVERAGE DAILY VOLUME AND VALUE
For the twelve-month period ending December 31, 2018, the average daily trading volume was 34,150
shares which resulted in an average daily trading value of $167,596.14. By comparison for the twelve-month period December 29, 2017 the average daily trading volume was 20,399 shares for an average value of $178,989.46.
During the three-month period from October 1, 2018 to December 31, 2018, the average volume per trading day was 21,097 shares for a value of $103,981.84. By comparison, for the three-month period from October 1, 2017 to December 29, 2017, the average volume per trading day was 28,165 shares for an average value of $134,035.34.

SHARE VOLUME AND VALUE LEADERS (TWELVE MONTH PERIOD)
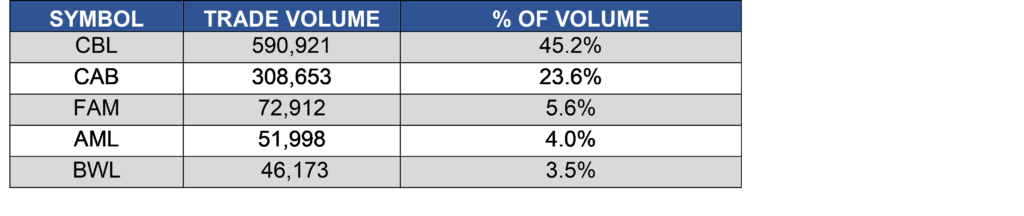
The top five share volume leaders on BISX for the twelve-month period January 2, 2018 to December 31, 2018 with their contribution to total traded volume displayed as a percentage were:

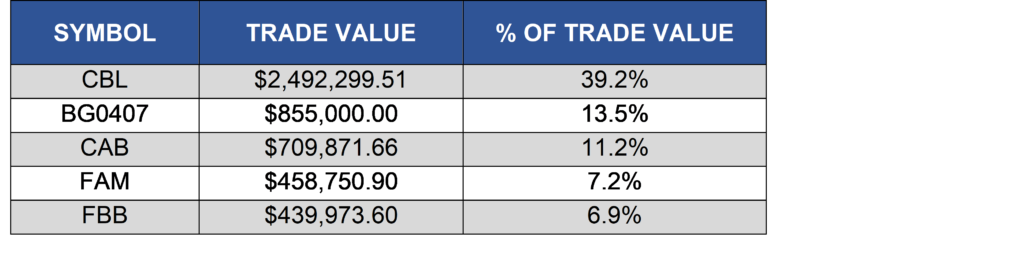
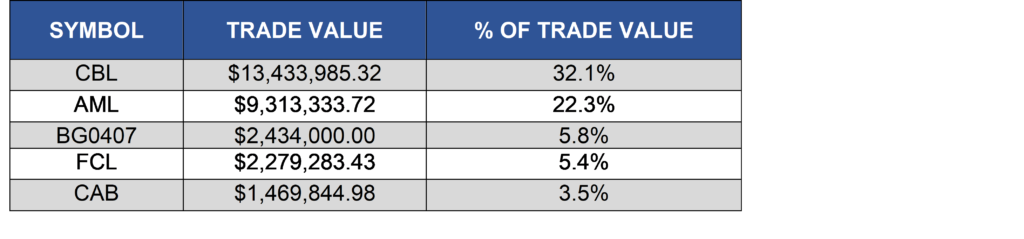
The top five share value leaders for the twelve-month period January 2, 2018 to December 31, 2018 with their contribution to total traded value displayed as a percentage were:
SHARE VOLUME AND VALUE LEADERS (THREE MONTH PERIOD)
The top five share volume leaders on BISX for the three-month period October 1, 2018 to December 31, 2018 with their contribution to total traded volume displayed as a percentage were:
The top five share value leaders for the three-month period October 1, 2018 to December 31, 2018 with their contribution to total traded value displayed as a percentage were: