Colina Holdings Bahamas Limited declared total dividends of $610,937.50 at the annual rate of B$Prime+1.5%, as of record date September 30, 2021, payable October 14, 2021.
BISX Quarterly Statistical Report Q2 2021
FOR IMMEDIATE PUBLICATION
JANUARY TO JUNE 2021 STATISTICAL REPORT
BISX is pleased to announce its BISX All-Share Index and trading statistics for the six-month period ending June 30, 2021 with comparison to the same period of 2020.
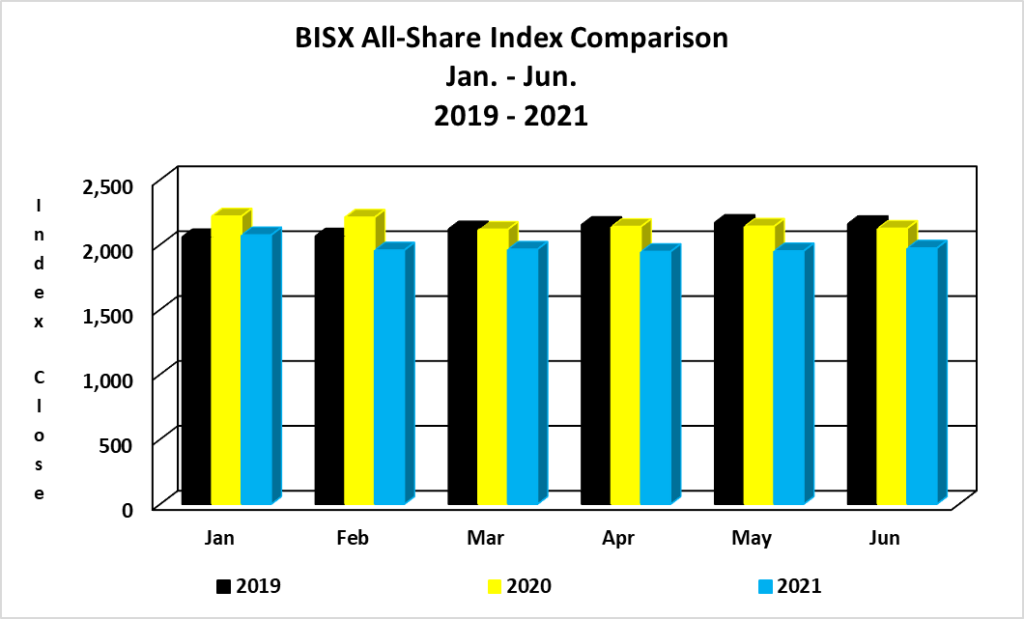
BISX ALL SHARE INDEX
For the six-month period ending June 30, 2021 the BISX All-Share Index closed at 1,972.76. This represents a year-to-date decrease of 119.7 or 5.72%. By comparison for the six-month period ending June 30, 2020 the BISX All-Share Index closed at 2,124.69. This represents a year-to-date decrease of 106.91 or 4.79%. The BISX All-Share Index is a market capitalization weighted index comprised of all primary market listings excluding debt securities.
As at June 30, 2021 the market was comprised of 20 ordinary shares with a market capitalization of $4.273 Billion. In addition, there were 8 preference shares with a market capitalization of $249 Million, 11 Bahamas Government Stock bonds as well as Corporate Bonds with a face value of $470 Million and approximately 200 tranches of Bahamas Registered Stock (BRS) with a face value of $3.3 Billion.
As at December 31, 2020 BISX had 74 mutual funds with total assets under management of approximately $5.4 Billion. This total includes 20 Bahamian mutual funds with total assets under management of $771 Million and 54 offshore mutual funds with total assets under management of $4.6 Billion.
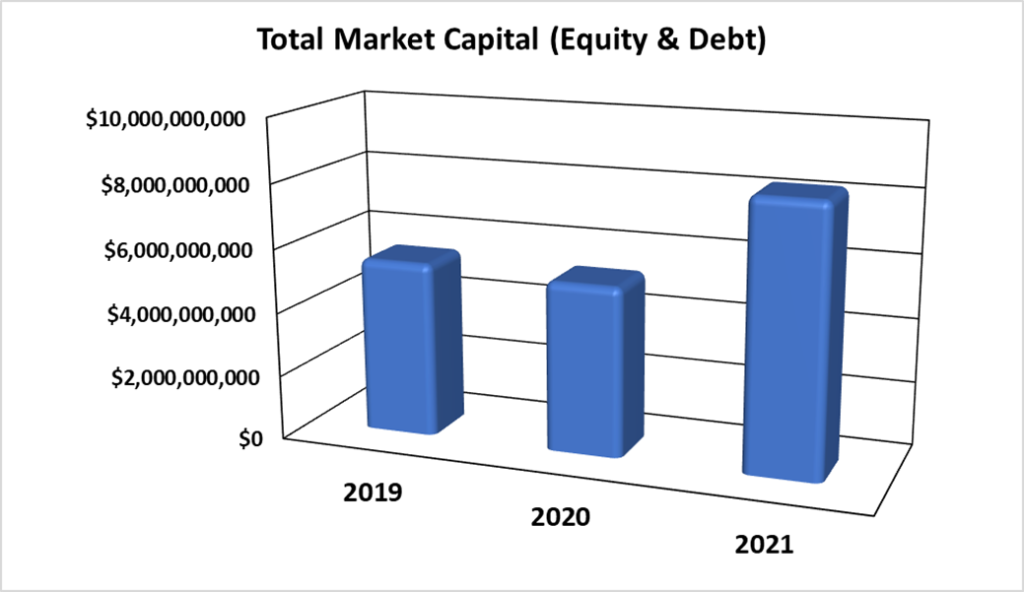
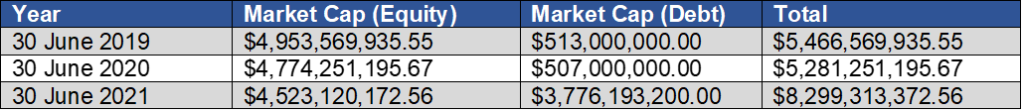
MARKET CAPITAL
Over the 3-year period 2019 to 2021, the market value of all securities listed on BISX has shown a decrease from 2019 to 2020. The increase from 2020 to 2021 was due to the listing of BGRS on BISX in July 2020; as indicated by the chart below:
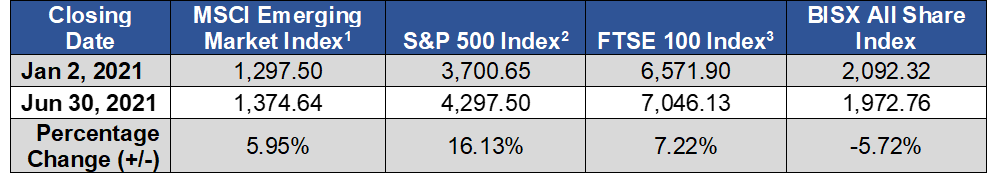
COMPARISON OF BISX ALL SHARE INDEX TO INTERNATIONAL INDICES
Over the 6-month period January 2 to June 30, 2021, some international equity markets have experienced decreases as indicated by the chart below:
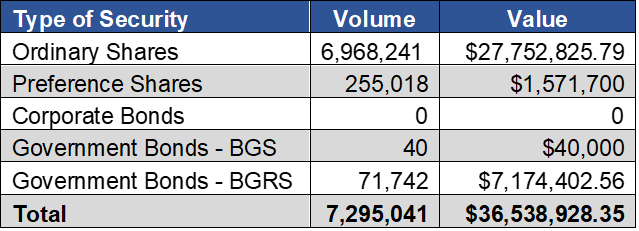
TOTAL TRADES BY SECURITY CLASS
For the three-month period ending June 30, 2021, each type of security produced the totals in the chart below.
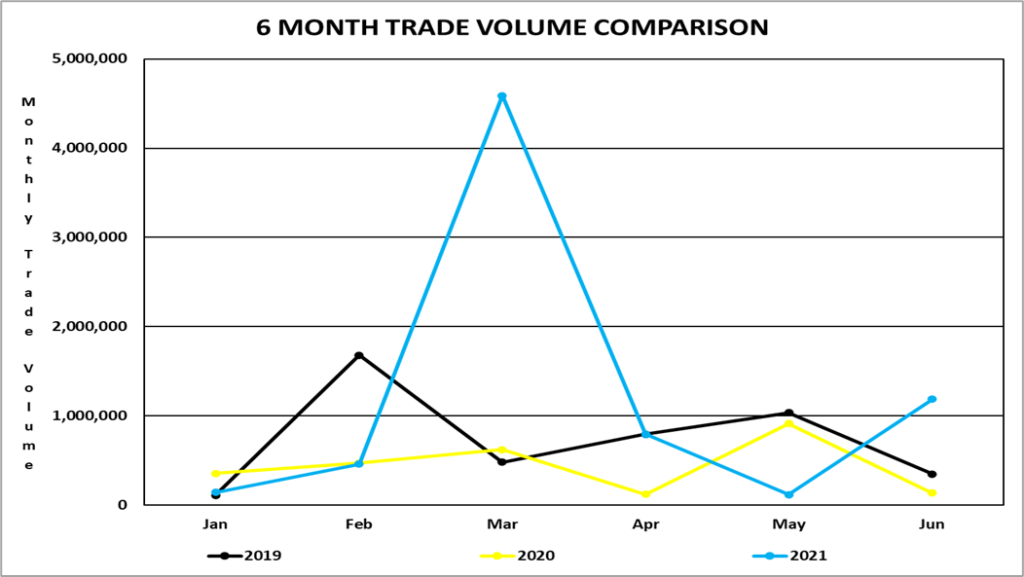
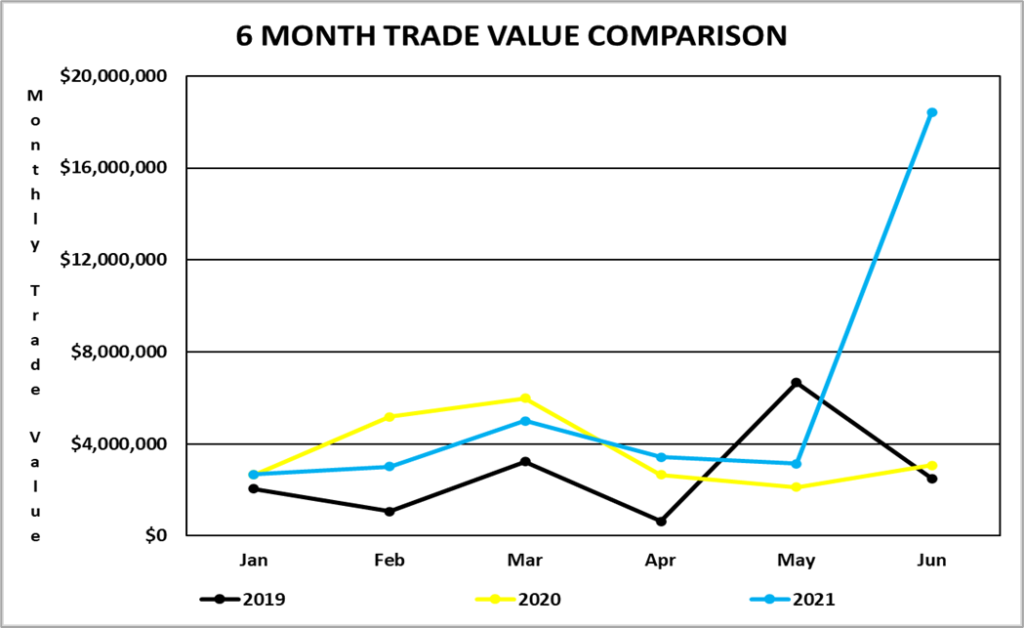
TRADING VOLUMES AND VALUES
Trading volume for the six-month period January 2, 2021, to June 30, 2021, was 7,295,041 shares for a value of $36,538,928.35. Trading volume for the six-month period January 2, 2020, to June 30, 2020, was 2,624,048 shares for a value of $11,622,255.68.
Trading volume for the three-month period April 1, 2021, to June 30, 2021, was 2,101,291 shares for a value of $ 11,539,873.88. Trading volume for the three-month period April 1, 2020, to June 30, 2020, was 1,173,646 shares for a value of $ $ 3,762,345.12.
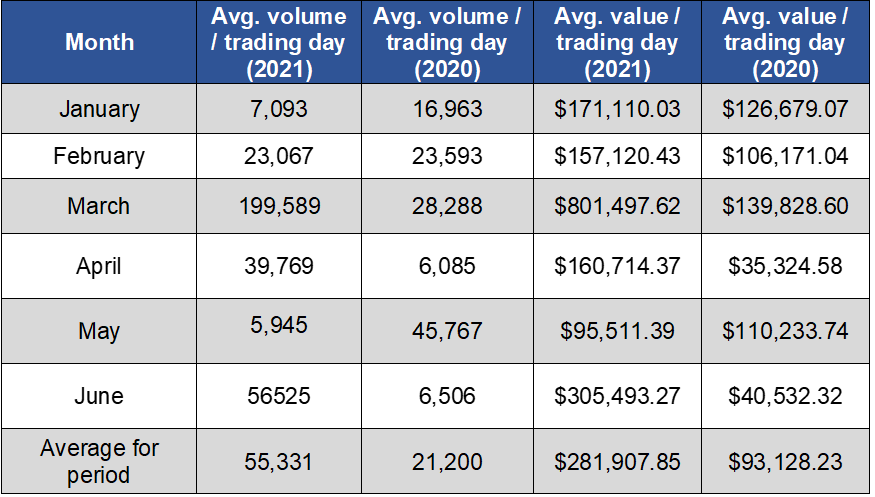
AVERAGE DAILY VOLUME AND VALUE
For the six-month period from January 2, 2021 to June 30, 2021, the average volume per trading day was 55,331 shares for a value of $281,907.85. By comparison, for the six-month period from January 2, 2020 to June 30, 2020, the average volume per trading day was 21,200 shares for a value of $93,128.23.
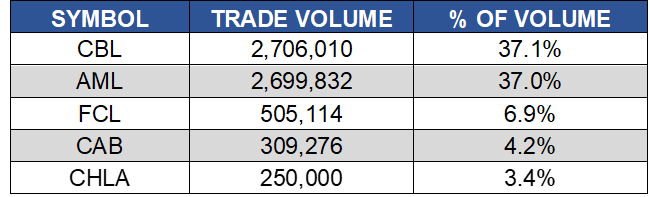
SHARE VOLUME AND VALUE LEADERS (SIX MONTH PERIOD)
The top five share volume leaders on BISX for the six-month period January 2, 2021 to June 30, 2021 with their contribution to total traded volume displayed as a percentage were:
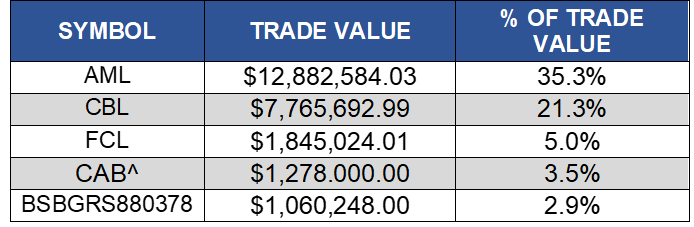
The top five share value leaders on BISX for the six-month period January 2, 2021 to June 30, 2021 with their contribution to total traded value displayed as a percentage were:
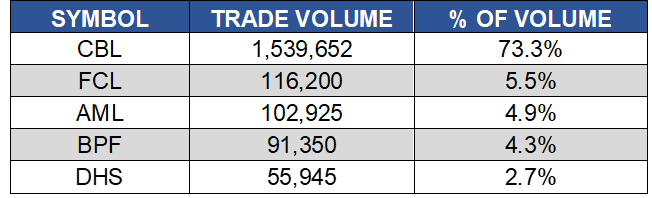
SHARE VOLUME AND VALUE LEADERS (THREE MONTH PERIOD)
The top five share volume leaders on BISX for the three-month period April 1, 2021 to June 30, 2021 with their contribution to total traded volume displayed as a percentage were:
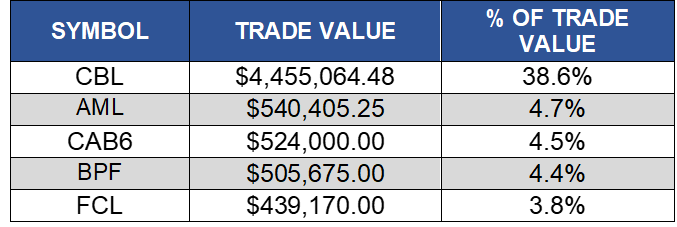
The top five share value leaders on BISX for the three-month period April 1, 2021 to June 30, 2021 with their contribution to total traded value displayed as a percentage were:
BISX Quarterly Statistical Report Q2 2021
The Bahamas International Securities Exchange released their Quarterly Statistical Report for Q2 2021. The Report can be viewed in the BISX News Section on the website.
AML Foods Limited Annual Report 2021
AML Foods Limited released their Annual Report for 2021. The Annual Report can be viewed in the News Section of AML Foods Limited under Annual Reports on the website.
Commonwealth Brewery Limited Q2 Financials Statements 2021
Commonwealth Brewery Limited released their Q2 Financials Statements for 2021. The Financial Statements can be viewed in the News Section of Commonwealth Brewery Limited under Quarterly Reports on the website.
Bahamas Waste Limited Q2 Financials Statements 2021
Bahamas Waste Limited released their Q2 Financials Statements for 2021. The Financial Statements can be viewed in the News Section of Bahamas Waste Limited under Quarterly Reports on the website.
- « Previous Page
- 1
- …
- 18
- 19
- 20
- 21
- 22
- …
- 203
- Next Page »