FamGuard Corporation Limited Dividend Notice (February 2018)
FamGuard Corporation Limited have declared dividends of $0.06 as of record date February 20, 2018, payable on February 27, 2018.
Finance Corporation of The Bahamas Limited Annual General Meeting
Please be advised that Finance Corporation of The Bahamas Limited will have their Annual General Meeting on Tuesday, April 17, 2018 at 6:30 p.m. The Notice for the Annual General Meeting can be viewed in the News Section of Finance Corporation of The Bahamas Limited under Corporate Filings on the website.
FOCOL Holdings Limited Q1 Financial Statements 2018
FOCOL Holdings Limited has released their Q1 Financial Statements for 2018. The Financial Statements can be viewed in the News Section of FOCOL Holdings Limited under Quarterly Reports on the website.
BISX Q4 Statistical Report 2017
FOR IMMEDIATE PUBLICATION
JANUARY TO DECEMBER 2017 STATISTICAL REPORT
BISX is pleased to announce its BISX All-Share Index and trading statistics for the twelve-month period ending December 29, 2017 with comparison to the same period of 2016.
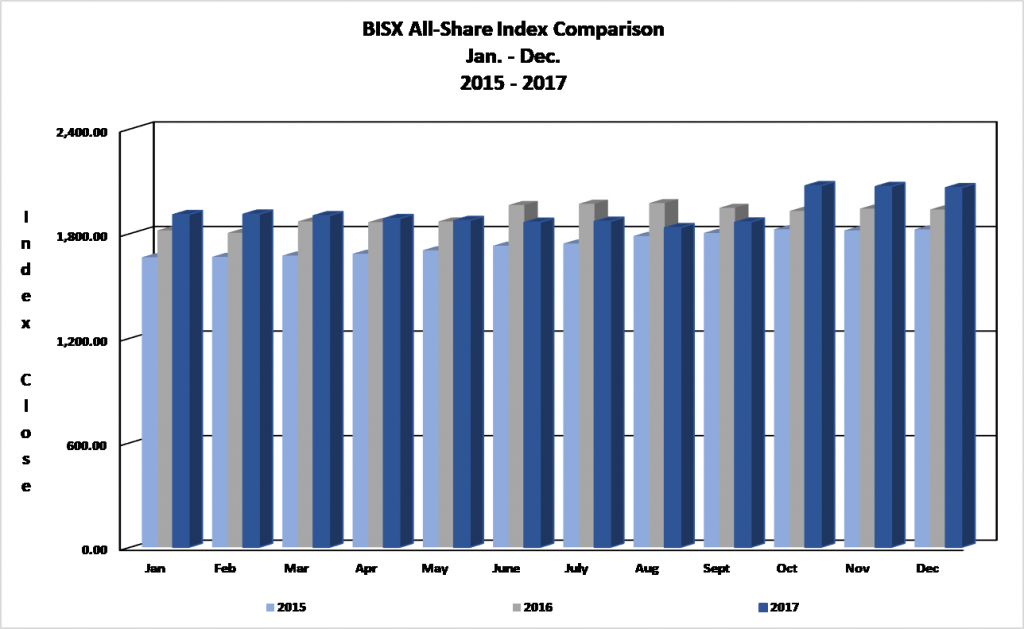
BISX ALL SHARE INDEX
For the twelve-month period ending December 29, 2017 the BISX All-Share Index closed at 2,063.57. This represents a year to date increase of 125.36 or 6.47%. By comparison for the twelve-month period ending December 30, 2016 the BISX All-Share Index closed at 1,938.21. That increase was a year to date increase of 114.26 or 6.26%. The BISX All-Share Index is a market capitalization weighted index comprised of all primary market listings excluding debt securities.
As at December 29, 2017 the market was comprised of 20 ordinary shares with a market capitalization of $4.43 Billion. In addition, there were 13 preference shares with a market capitalization of $327 Million and 19 bonds with a face value of $579 Million.
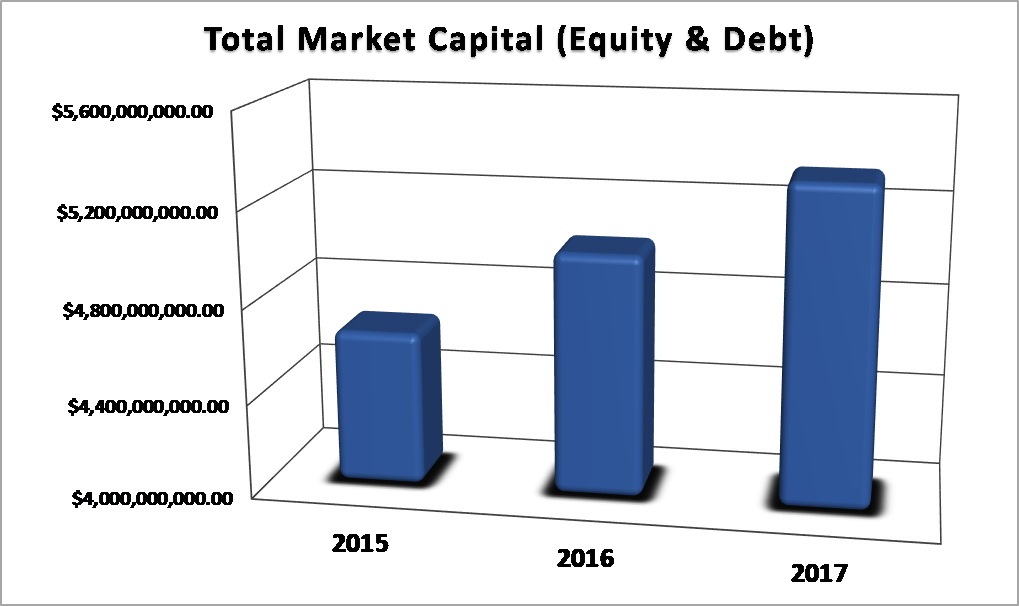
MARKET CAPITAL
Over the 3-year period 2015 to 2017, the market value of all securities listed on BISX has shown increases as indicated by the chart below:
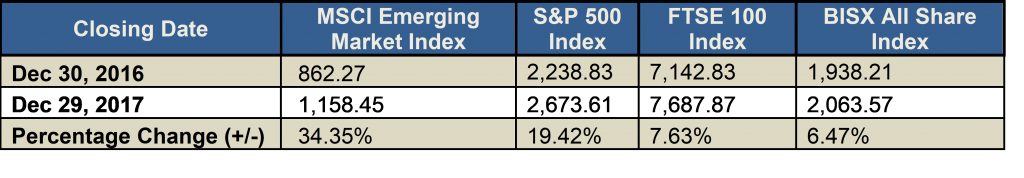
COMPARISON OF BISX ALL SHARE INDEX TO INTERNATIONAL INDICES
Over the 12-month period January 1 to December 29, 2017, some international equity markets have experienced decreases / increases as indicated by the chart below:
TOTAL TRADES BY SECURITY CLASS
For the twelve-month period ending December 29, 2017, each type of security produced the totals in the chart below.

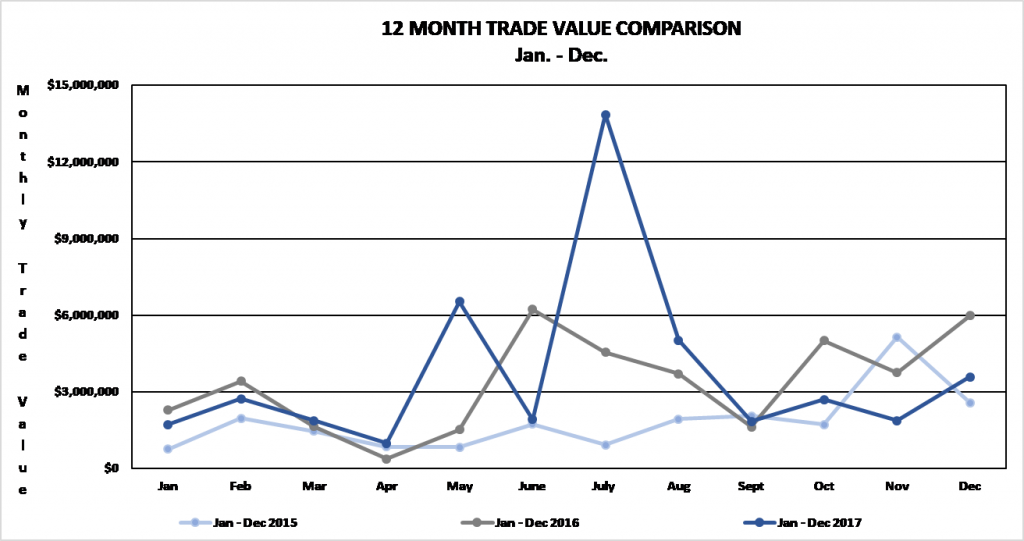
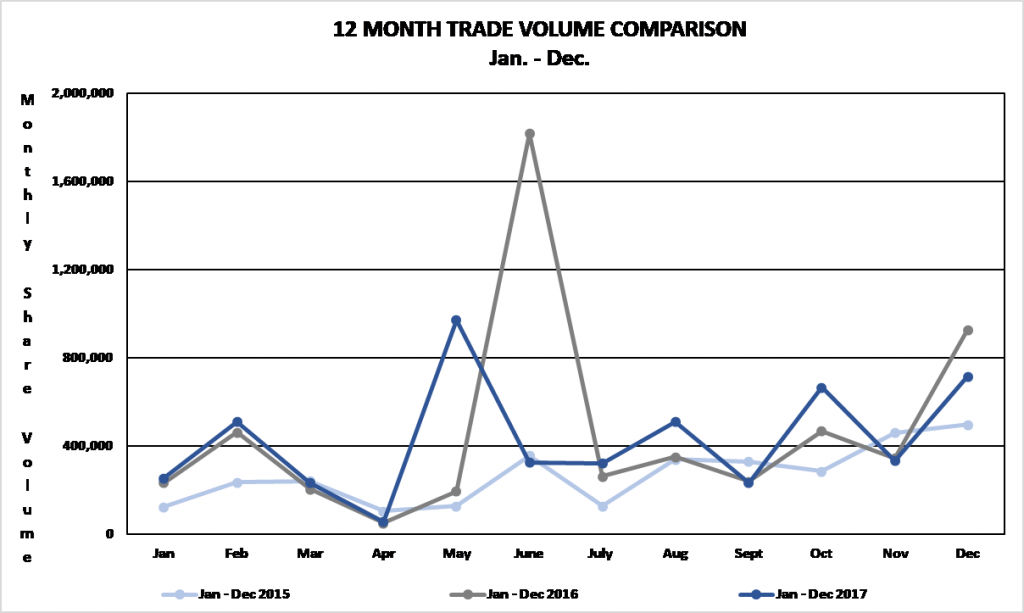
TRADING VOLUMES AND VALUES
Trading volume for the twelve-month period January 1, 2017 to December 29, 2017 was 5,128,595 shares for a value of $44,596,767. Trading volume for the twelve-month period January 1, 2016 to December 30, 2016 was 5,552,593 shares for a value of $40,070,454.82.
Trading volume for the three-month period October 1 to December 29, 2017 was 1,714,335 shares for a value of $8,151,746. By comparison, for the three-month period from October 1 to December 30, 2016 was 1,738,991 shares for a value of $14,748,550.66.
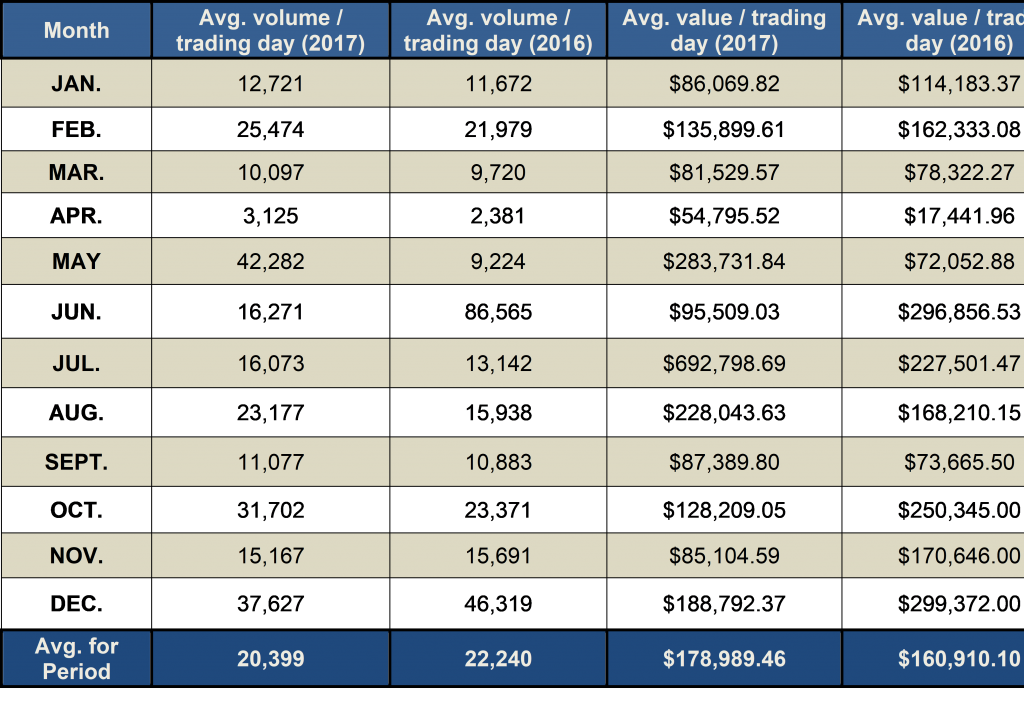
AVERAGE DAILY VOLUME AND VALUE
For the twelve-month period ending December 29, 2017, the average daily trading volume was 20,399 shares which resulted in an average daily trading value of $178,989.46. By comparison for the twelve-month period December 30, 2016 the average daily trading volume was 22,240 shares for an average value of $160,910.10.
During the three-month period from October 1, 2017 to December 29, 2017, the average volume per trading day was 28,165 shares for a value of $134,035.34. By comparison, for the three-month period from October 1, 2016 to December 30, 2016, the average volume per trading day was 28,460 shares for an average value of $90,523.05.
SHARE VOLUME AND VALUE LEADERS (TWELVE MONTH PERIOD)
The top five share volume leaders on BISX for the twelve-month period January 1, 2017 to December 29, 2017 with their contribution to total traded volume displayed as a percentage were:

The top five share value leaders for the twelve-month period January 1, 2017 to December 29, 2017 with their contribution to total traded value displayed as a percentage were:

SHARE VOLUME AND VALUE LEADERS (THREE MONTH PERIOD)
The top five share volume leaders on BISX for the three-month period October 1, 2017 to December 29, 2017 with their contribution to total traded volume displayed as a percentage were:

The top five share value leaders for the three-month period October 1, 2017 to December 29, 2017 with their contribution to total traded value displayed as a percentage were:

BISX Q4 Statistical Report 2017
BISX has released their Q4 Statistical Report for 2017. The Statistical Report can be viewed in the BISX News Section on the website
Emera Incorporated Dividend Notice (February 2018)
Emera Incorporated has declared dividends of CAD$0.14125 per Bahamas Depository Receipt and CAD$0.565 per common share of Emera, as of record date February 1, 2018, payable on February 15, 2018.