FOR IMMEDIATE PUBLICATION
JANUARY TO DECEMBER 2017 STATISTICAL REPORT
BISX is pleased to announce its BISX All-Share Index and trading statistics for the twelve-month period ending December 29, 2017 with comparison to the same period of 2016.
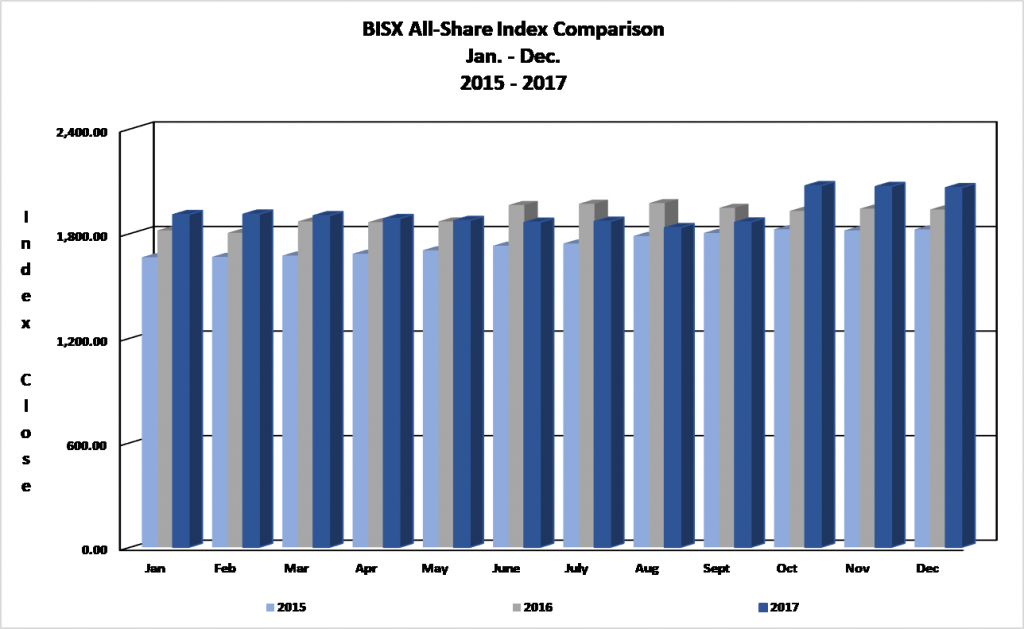
BISX ALL SHARE INDEX
For the twelve-month period ending December 29, 2017 the BISX All-Share Index closed at 2,063.57. This represents a year to date increase of 125.36 or 6.47%. By comparison for the twelve-month period ending December 30, 2016 the BISX All-Share Index closed at 1,938.21. That increase was a year to date increase of 114.26 or 6.26%. The BISX All-Share Index is a market capitalization weighted index comprised of all primary market listings excluding debt securities.
As at December 29, 2017 the market was comprised of 20 ordinary shares with a market capitalization of $4.43 Billion. In addition, there were 13 preference shares with a market capitalization of $327 Million and 19 bonds with a face value of $579 Million.
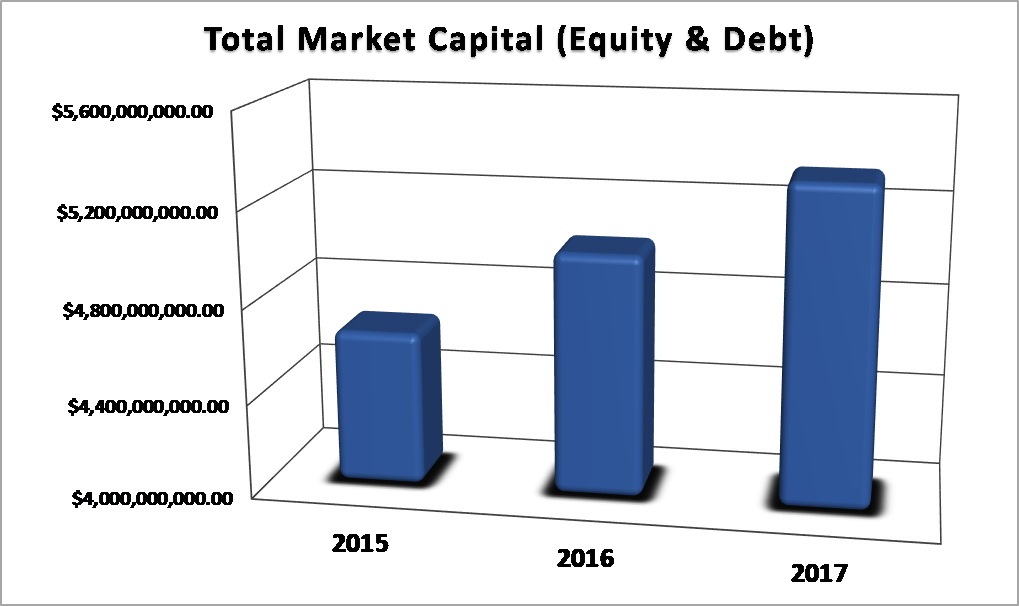
MARKET CAPITAL
Over the 3-year period 2015 to 2017, the market value of all securities listed on BISX has shown increases as indicated by the chart below:
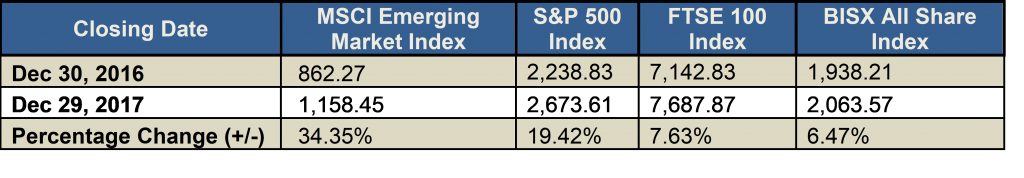
COMPARISON OF BISX ALL SHARE INDEX TO INTERNATIONAL INDICES
Over the 12-month period January 1 to December 29, 2017, some international equity markets have experienced decreases / increases as indicated by the chart below:
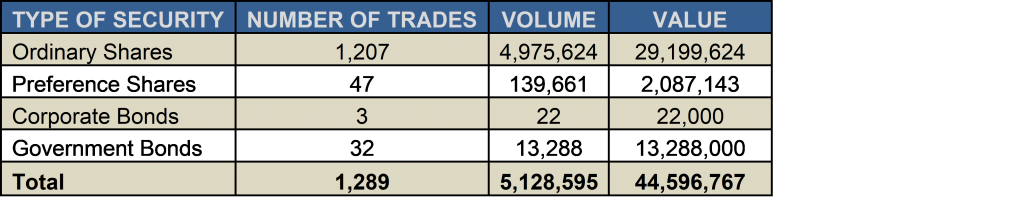
TOTAL TRADES BY SECURITY CLASS
For the twelve-month period ending December 29, 2017, each type of security produced the totals in the chart below.
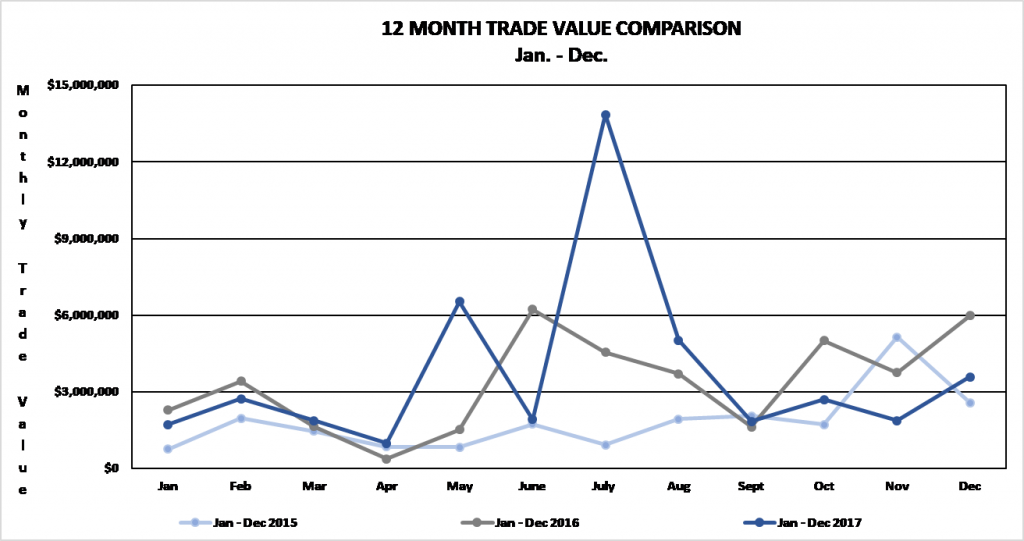
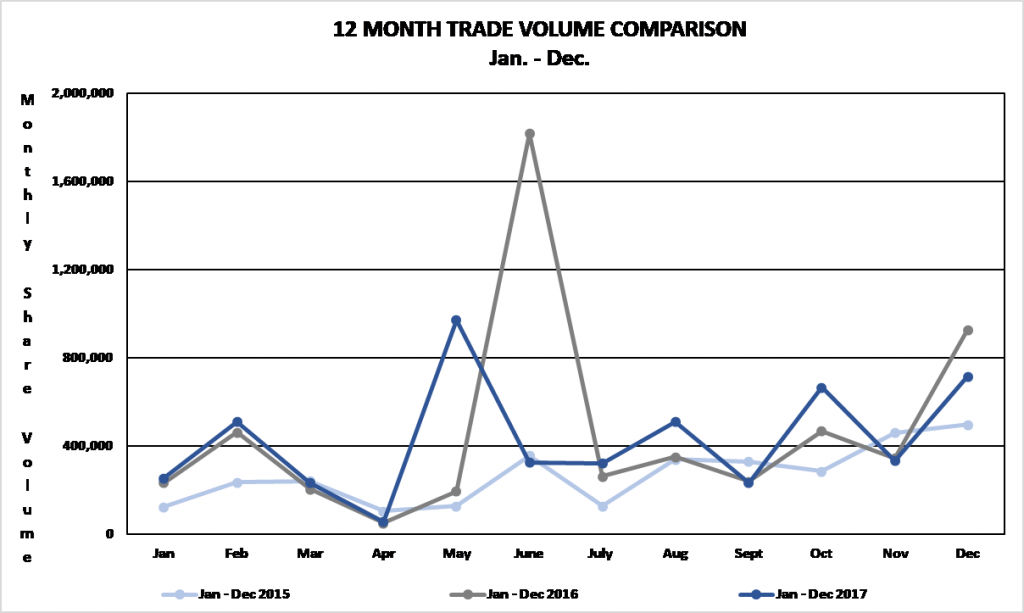
TRADING VOLUMES AND VALUES
Trading volume for the twelve-month period January 1, 2017 to December 29, 2017 was 5,128,595 shares for a value of $44,596,767. Trading volume for the twelve-month period January 1, 2016 to December 30, 2016 was 5,552,593 shares for a value of $40,070,454.82.
Trading volume for the three-month period October 1 to December 29, 2017 was 1,714,335 shares for a value of $8,151,746. By comparison, for the three-month period from October 1 to December 30, 2016 was 1,738,991 shares for a value of $14,748,550.66.
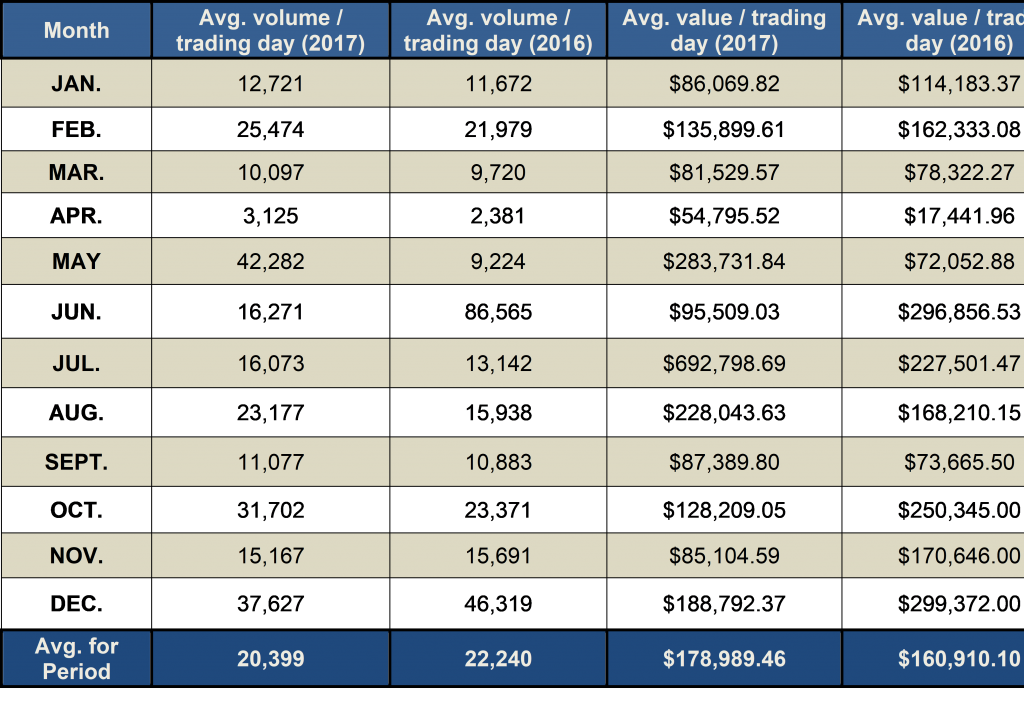
AVERAGE DAILY VOLUME AND VALUE
For the twelve-month period ending December 29, 2017, the average daily trading volume was 20,399 shares which resulted in an average daily trading value of $178,989.46. By comparison for the twelve-month period December 30, 2016 the average daily trading volume was 22,240 shares for an average value of $160,910.10.
During the three-month period from October 1, 2017 to December 29, 2017, the average volume per trading day was 28,165 shares for a value of $134,035.34. By comparison, for the three-month period from October 1, 2016 to December 30, 2016, the average volume per trading day was 28,460 shares for an average value of $90,523.05.
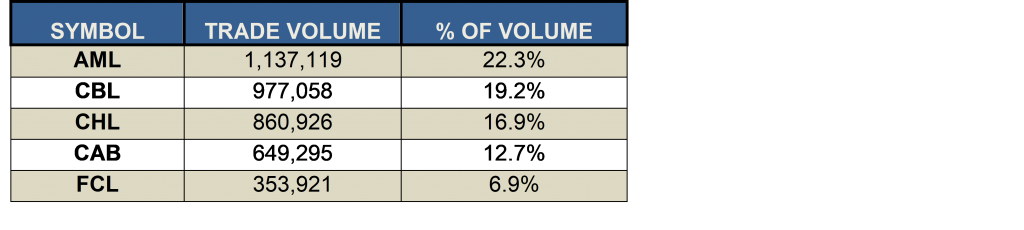
SHARE VOLUME AND VALUE LEADERS (TWELVE MONTH PERIOD)
The top five share volume leaders on BISX for the twelve-month period January 1, 2017 to December 29, 2017 with their contribution to total traded volume displayed as a percentage were:
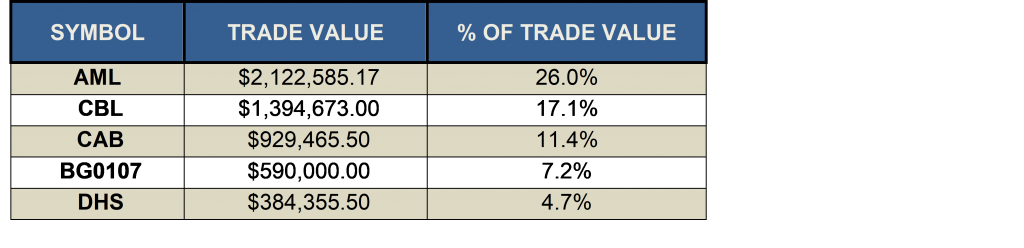
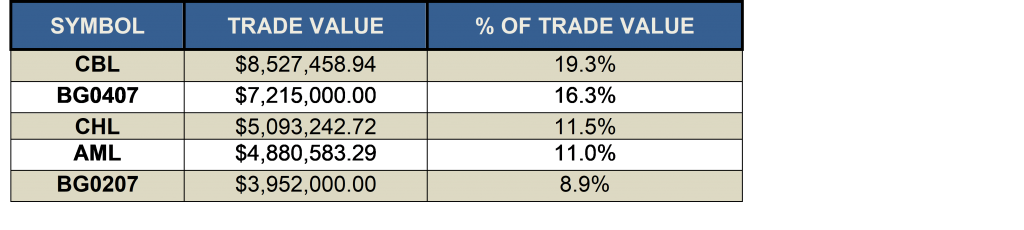
The top five share value leaders for the twelve-month period January 1, 2017 to December 29, 2017 with their contribution to total traded value displayed as a percentage were:
SHARE VOLUME AND VALUE LEADERS (THREE MONTH PERIOD)
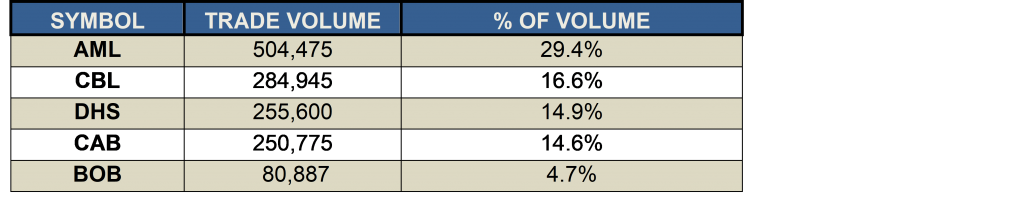
The top five share volume leaders on BISX for the three-month period October 1, 2017 to December 29, 2017 with their contribution to total traded volume displayed as a percentage were:
The top five share value leaders for the three-month period October 1, 2017 to December 29, 2017 with their contribution to total traded value displayed as a percentage were: