FOCOL Holdings Limited 2017 Q1 Financial Statements
FOCOL Holdings Limited has released its 2017 Q1 Financial Statements. The Financial Statements can be viewed in the Quarterly Reports Section of the “News” tab of FOCOL Holdings Limited.
Bank of The Bahamas 2016 Year End Financial Statements
The Bank of The Bahamas has released their 2016 Year End Financial Statements. The financial statements can be viewed in the Annual Reports Section of the “News” tab of The Bank of the Bahamas.
Commonwealth Brewery Limited Dividend Notice (Dec. 2016)
Commonwealth Brewery Limited has declared dividends of $0.13 to shareholders of record date as of December 23, 2016 payable on December 23, 2016.
BISX Q3 2016 Quarterly Statistical Report
BISX released its Q3 Quarterly Statistical Report. The Report can be seen in the BISX News Section.
BISX Q3 2016 Quarterly Statistical Report
|
BISX PRESS RELEASE |
FOR IMMEDIATE PUBLICATION
JANUARY TO SEPTEMBER 2016 STATISTICAL REPORT
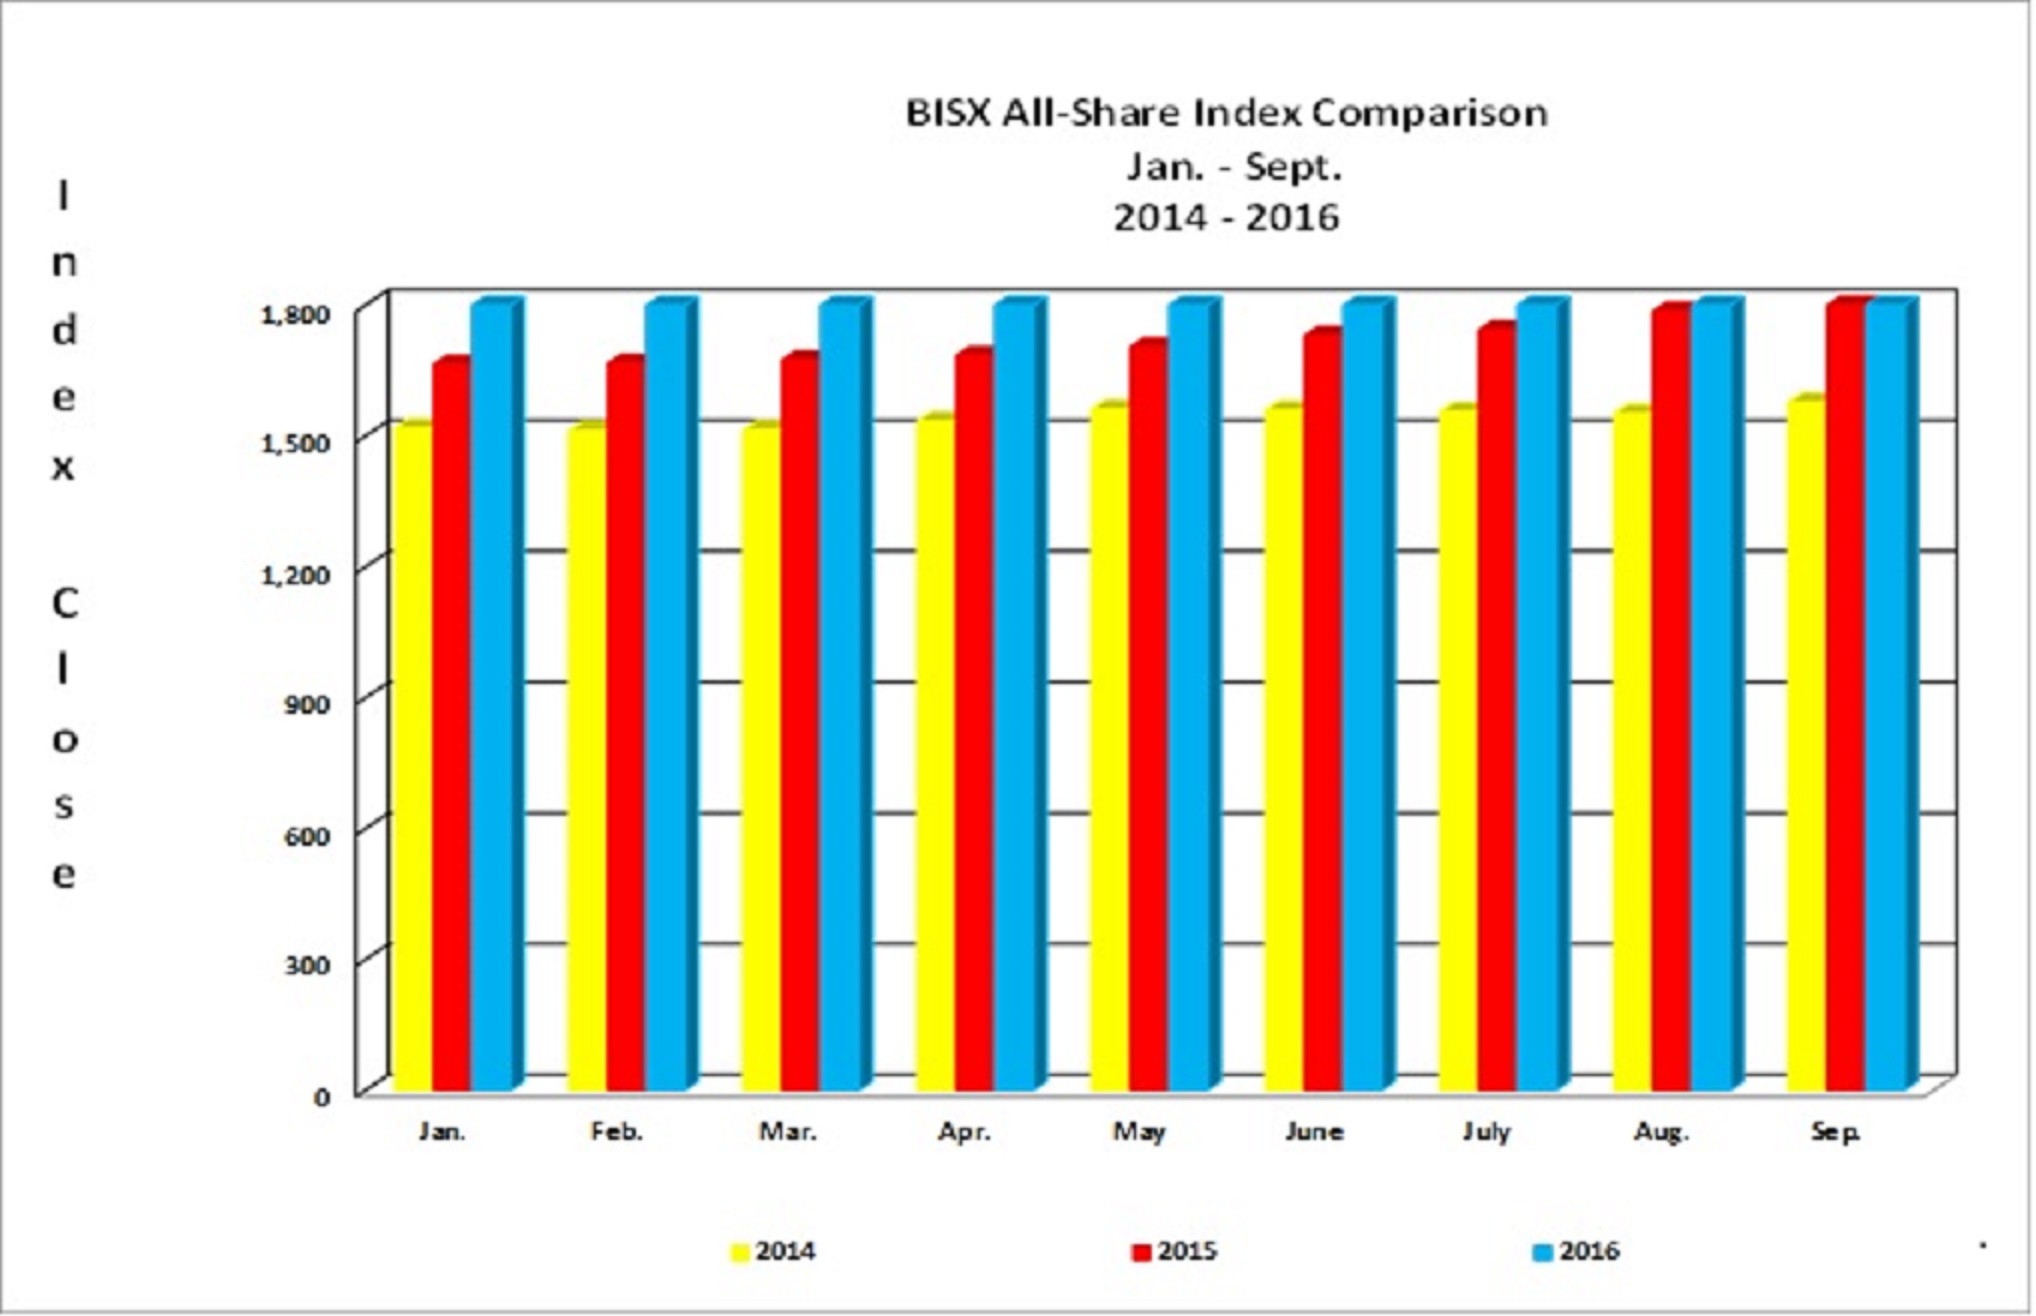
BISX is pleased to announce its BISX All-Share Index and trading statistics for the nine month period ending September 30, 2016 with comparison to the same period of 2015.
BISX ALL SHARE INDEX
For the nine month period ending September 30, 2016 the BISX All-Share Index closed at 1,947.88 this represented a year to date increase of 123.93 or 6.79%. By comparison for the nine month period ending September 30, 2015 the BISX All-Share Index closed at 1,803.54, this represented a year to date increase of 144.34 or 7.41%. The BISX All-Share Index is a market capitalization weighted index comprised of all primary market listings excluding debt securities.
As at September 30, 2016 the market was comprised of 20 ordinary shares with a market capitalization of $4.14 Billion. In addition, there were 13 preference shares with a market capitalization of $327.37 Million and 16 bonds with a face value of $505 Million.
COMPARISON OF BISX ALL SHARE INDEX TO INTERNATIONAL INDICES
Over the 9 month period January 1 to September 30, 2016, some international equity markets have experienced increases as indicated by the chart below:
| Closing Date | MSCI Emerging Market Index[1] | S&P 500 Index[2] | FTSE 100 Index[3] | BISX All Share Index |
| Dec 31, 2015 | 794.14 | 2,043.94 | 6,242.32 | 1,823.95 |
| Sep 30, 2016 | 903.460 | 2,168.27 | 6,899.33 | 1,947.88 |
| % Chg (+/-) | 13.77% | 6.1% | 10.5% | 6.79% |
TRADING VOLUMES AND VALUES
Trading volume for the nine month period January 1, 2016 to September 30, 2016 was 3,813,602.00 shares for a value of $25,321,904.16.
Trading volume for the three month period July 1, 2016 to September 30, 2016 was 852,915 shares for a value of $9,871,095.51.

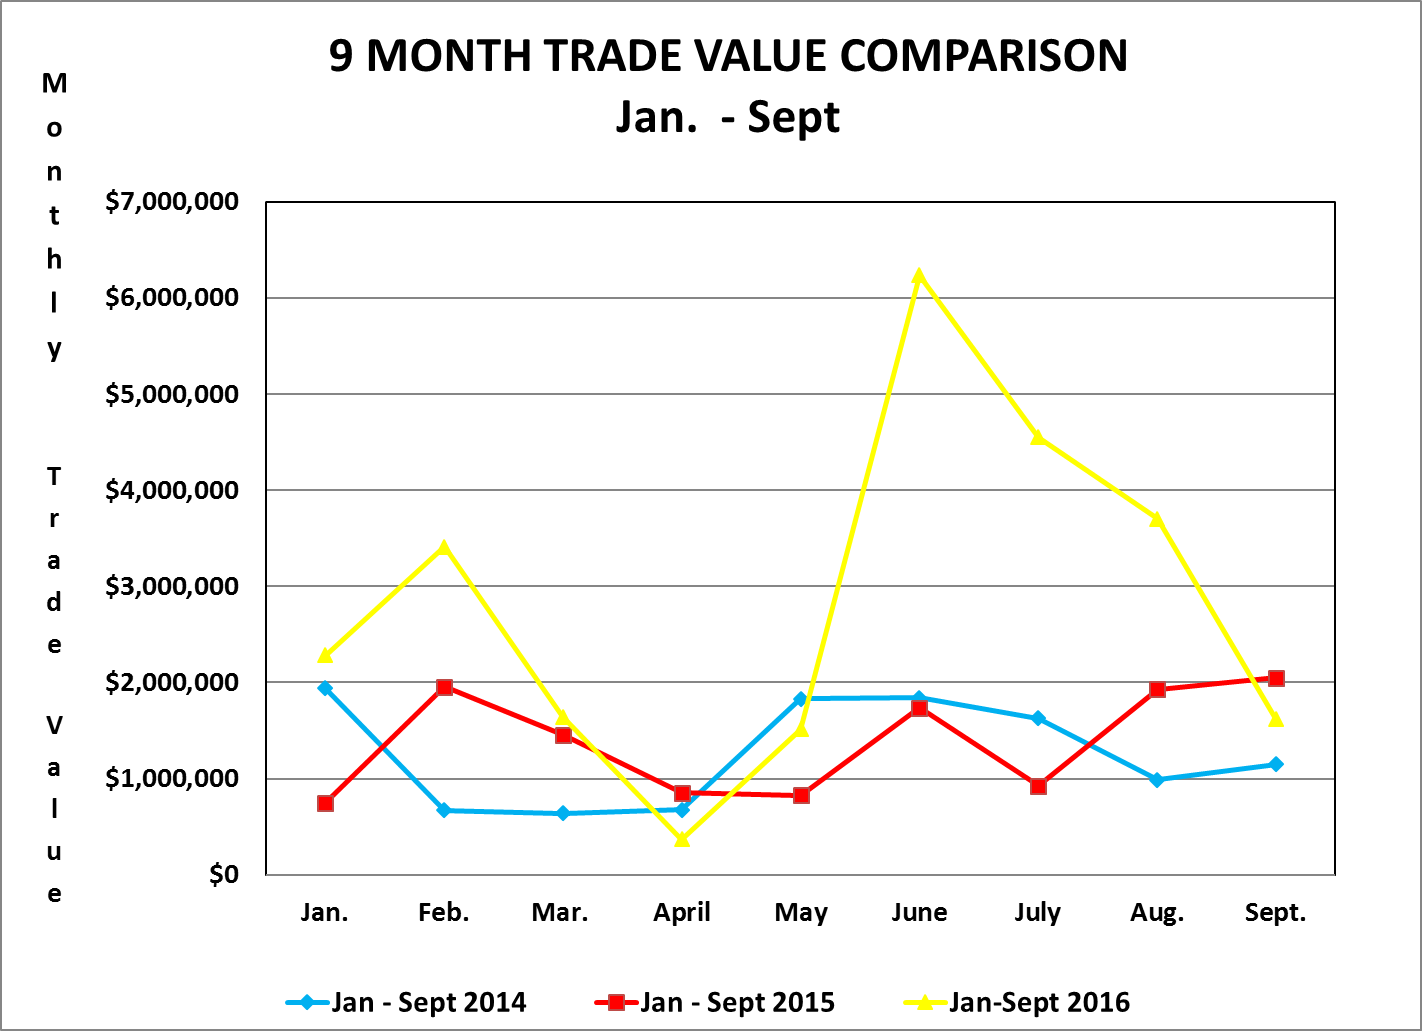
AVERAGE DAILY VOLUME AND VALUE
For the nine month period from January 1, 2016 to September 30, 2016, the average volume per trading day was 20,239.55 shares for a value of $134,582.47. By comparison, for the nine month period from January 1, 2015 to September 30, 2015, the average volume per trading day was 10,567 shares for an average value of $66,576.44.
|
Month |
Avg. volume / trading day (2016) | Avg. volume / trading day (2015) | Avg. value / trading day (2016) | Avg. value / trading day (2015) |
|
January |
11,672 | 6,176 | 114,183.37 | $37,290.51 |
|
February |
21,979 | 11,754 | 162,333.08 | $97,775.11 |
|
March |
9,720 | 10,927 | 78,322.27 | $66,202.86 |
| April | 2,381 | 5,256 | 17,441.96 |
$42,475.68 |
| May | 9,224 | 6,335 | 72,052.88 |
$41,384.60 |
| June | 86,565 | 16,998 | 296,856.53 |
$82,739.65 |
| July | 12,516 | 5,768 | 216,668.07 |
$41,974.25 |
|
August |
16,697 | 16,910 | 176,210.72 | $96,321.06 |
| September | 11,402 | 14,982 | 77,173.38 |
$93,024.13 |
|
Average for period |
20,239.55 | 10,567 | 134,582.47 |
$66,576.44 |
SHARE VOLUME AND VALUE LEADERS (NINE MONTH PERIOD)
The top five share volume leaders on BISX for the nine month period January 1, 2016 to September 30, 2016 with their contribution to total traded volume displayed as a percentage were:
|
SYMBOL |
TRADE VOLUME | % OF VOLUME |
|
DHS |
1,557,513.00 | 40.8% |
|
FCL |
426,073.00 | 11.2% |
| CBL | 370,520.00 |
9.7% |
| CAB | 267,626.00 |
7.0% |
| CHL | 251,794.00 |
6.6% |
The top five share value leaders for the nine month period January 1, 2016 to September 30, 2016 with their contribution to total traded value displayed as a percentage were:
|
SYMBOL |
TRADE VALUE | % OF TRADE VALUE |
|
CBL |
$ 3,335,288.81 | 12.6% |
|
FCL |
$ 2,951,312.75 | 11.2% |
| FIN | $ 2,335,991.90 |
8.9% |
| DHS | $ 2,203,327.29 |
8.3% |
| CAB | $ 1,779,375.02 |
6.7% |
SHARE VOLUME AND VALUE LEADERS (THREE MONTH PERIOD)
The top five share volume leaders on BISX for the three month period July 1, 2016 to September 30, 2016 with their contribution to total traded volume displayed as a percentage were:
|
SYMBOL |
TRADE VOLUME | % OF VOLUME |
|
AML |
146,200 | 17.1% |
|
FCL |
100,247 | 11.7% |
| CBL | 99,712 |
11.6% |
| FIN | 83,986 |
9.8% |
| CIB | 62,861 |
7.3% |
The top five share value leaders for the three month period July 1, 2016 to September 30, 2016 with their contribution to total traded value displayed as a percentage were:
|
SYMBOL |
TRADE VALUE | % OF TRADE VALUE |
|
BG0203 |
$ 2,069,000.00 | 18.9% |
|
BG0305 |
$ 1,069,000.00 | 9.8% |
| CBL | $ 1,046,954.95 |
9.6% |
| FIN | $ 914,627.40 |
8.4% |
| FCL | $ 810,925.25 |
7.4% |
For Additional Information Contact:
Elude Michel-Sturrup
Tel: 242-323-2330
Fax: 242-323-2320
Email: info@bisxbahamas.com
ICD Utilities New Corporate Secretary
The Corporate Secretary of ICD Utilities has been changed. The notice for the New Corporate Secretary can be viewed in the Corporate Filings Section of the “News” tab of ICD Utilities.