Please be advised that Allan Edgeworth and James (Jim) D. Eisenhauer resigned from the board of Emera Incorporated. The director notification form can be viewed in the News Section of Emera Incorporated, under Corporate Filings on the website.
J S Johnson Company Limited Dividend Notice (June 2019)
J S Johnson Company Limited has declared dividends of $0.15 to shareholders as of record date May 28, 2019, payable on June 4, 2019.
Bank of the Bahamas Limited Director Change
Please be advised that Ruth Bowe-Darville resigned as the Director of Bank of The Bahamas. The Director Notification Form and the Notice can be found in the News Section of Bank of The Bahamas Limited under Corporate Filings on the website.
Commonwealth Brewery Limited Q1 Financial Statements 2019
Commonwealth Brewery Limited released their Q1 Financial Statements for 2019. The Financial Statements can be viewed in the News Section of Commonwealth Brewery Limited under Quarterly Reports on the website.
BISX Q1 Statistical Report 2019
FOR IMMEDIATE PUBLICATION
JANUARY TO MARCH 2019 STATISTICAL REPORT
BISX is pleased to announce its BISX All-Share Index and trading statistics for the three-month period ending March 29, 2019 with comparison to the same period of 2018.
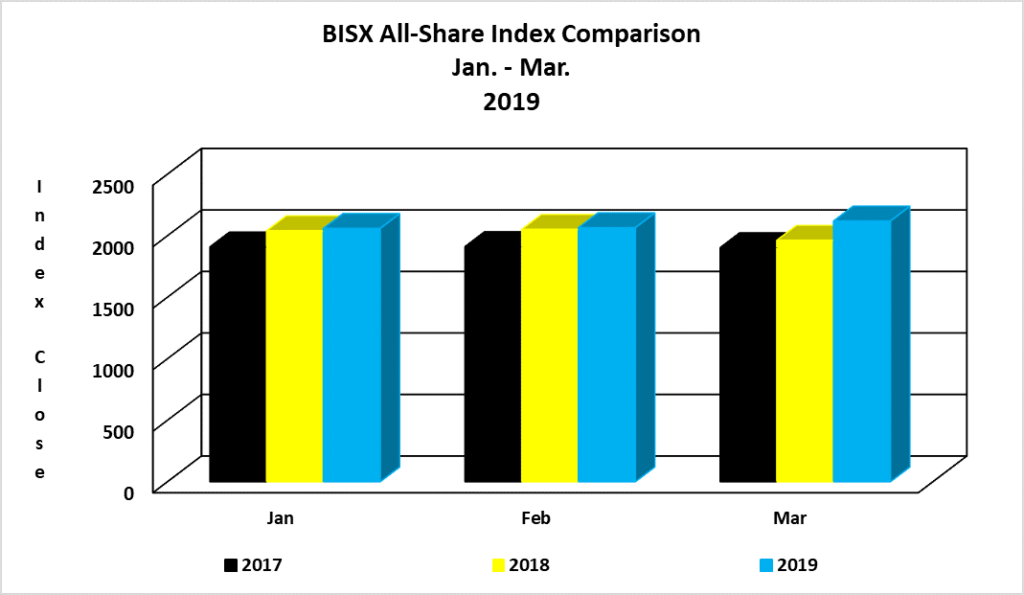
BISX ALL SHARE INDEX
For the three-month period ending March 29, 2019 the BISX All-Share Index closed at 2119.29. This represents a year to date increase of 9.88 or 0.47%. By comparison for the three-month period ending March 29, 2018 the BISX All-Share Index closed at 1,962.11. That was a year to date decrease of -101.46 or -4.92%. The BISX All-Share Index is a market capitalization weighted index comprised of all primary market listings excluding debt securities.
As at March 29, 2018 the market was comprised of 19 ordinary shares with a market capitalization of $4.85 Billion. In addition, there were 13 preference shares with a market capitalization of $327 million and 13 bonds with a face value of $513 Million.
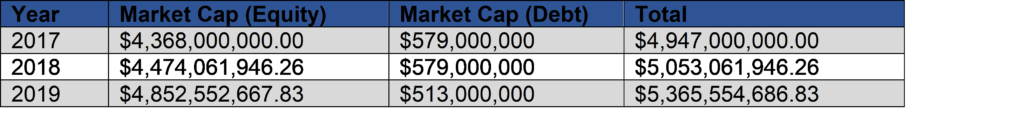
MARKET CAPITAL
Over the 3-year period 2017 to 2019, the market value of all securities listed on BISX has shown an increase, during the as indicated by the chart below:
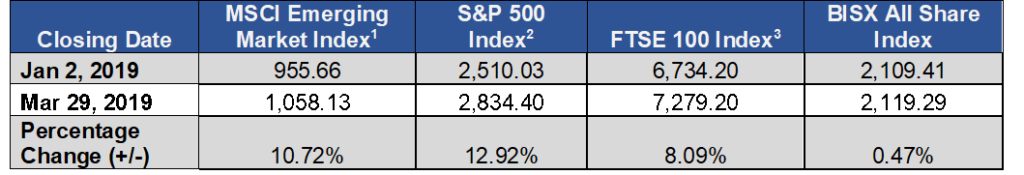
COMPARISON OF BISX ALL SHARE INDEX TO INTERNATIONAL INDICES
Over the three-month period January 2 to March 29, 2019, some international equity markets have experienced increases as indicated by the chart below:
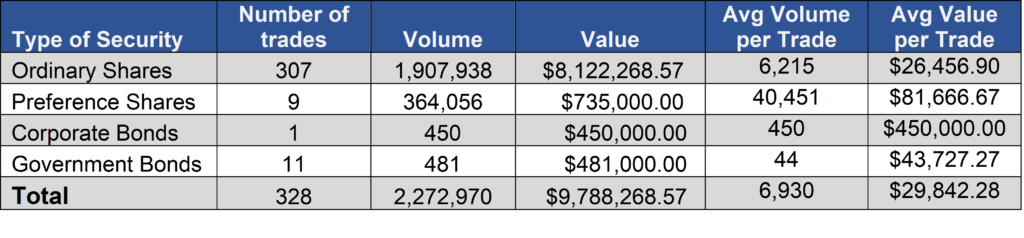
TOTAL TRADES BY SECURITY CLASS
For the three-month period ending March 29, 2019, each type of security produced the totals in the chart below.
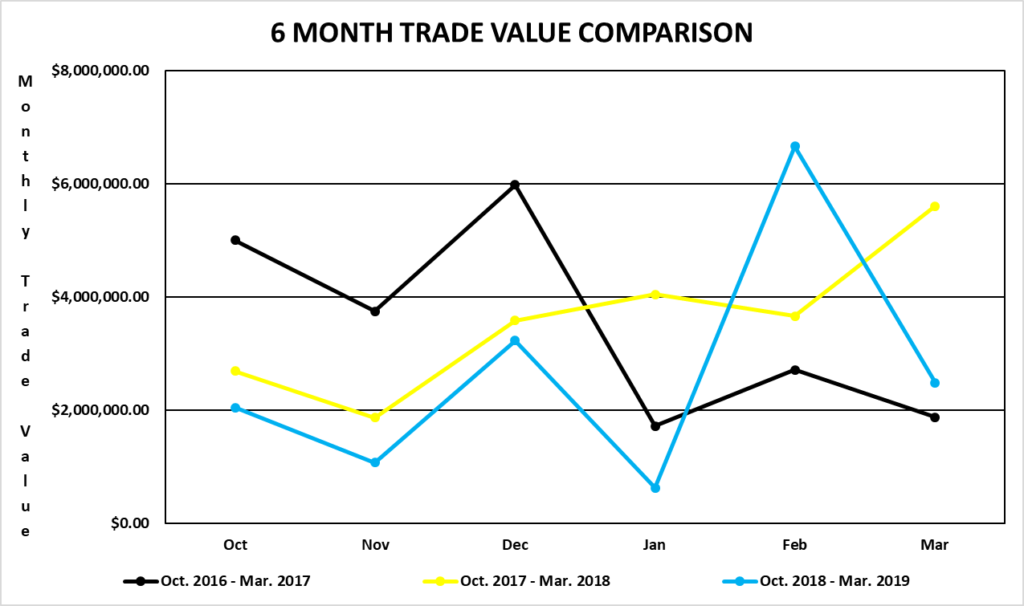
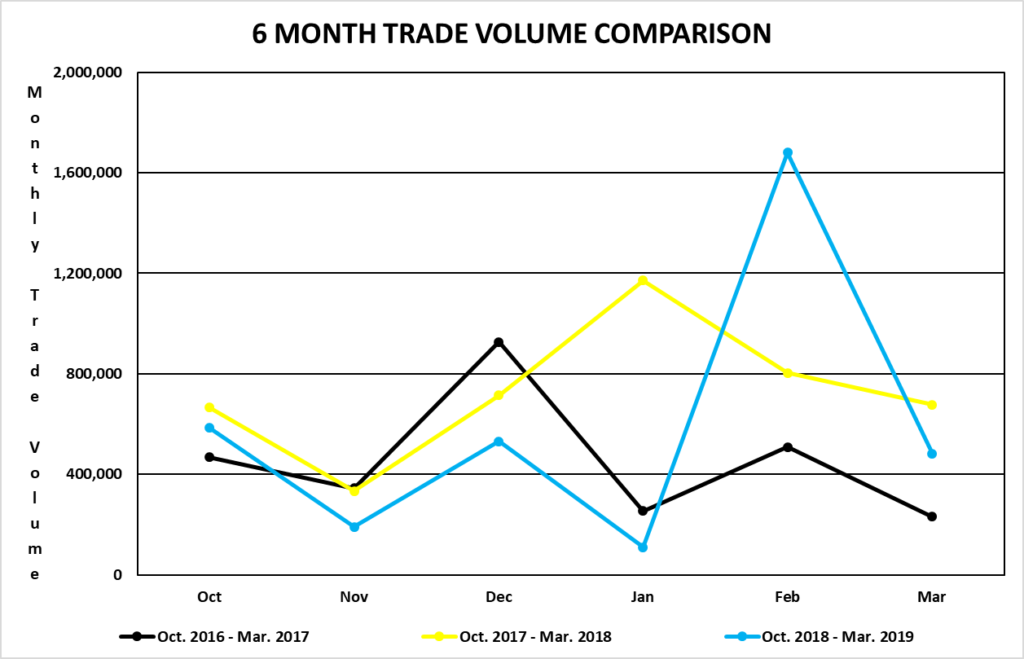
TRADING VOLUMES AND VALUES
Trading volume for the three-month period January 2, 2019 to March 29, 2019 was 2,272,970 shares for a value of $9,788,268.57. By comparison, trading volume for the three-month period January 2, 2018 to March 29, 2018 was 2,651,061 shares for a value of $13,323,691.
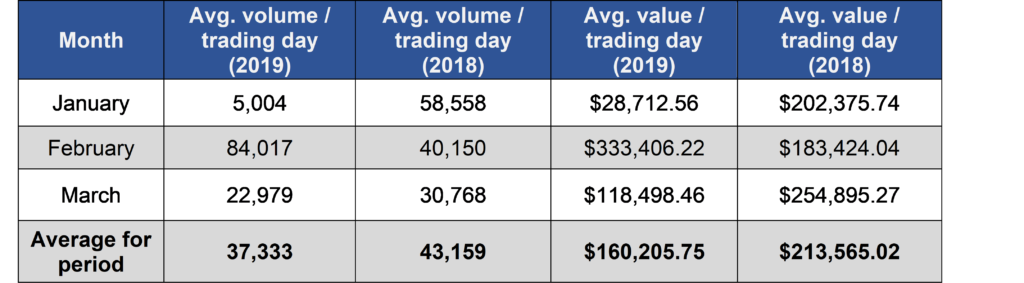
AVERAGE DAILY VOLUME AND VALUE
For the three-month period from January 2, 2019 to March 29, 2019, the average volume per trading day was 37,333 shares for a value of $ 160,205.75. By comparison, for the three-month period from January 2, 2018 to March 29, 2018, the average volume per trading day was 43,159 shares for a value of $213,565.02.
SHARE VOLUME AND VALUE LEADERS (THREE MONTH PERIOD)
The top five share volume leaders on BISX for the three-month period January 2, 2019 to March 29, 2019 with their contribution to total traded volume displayed as a percentage were:

The top five share value leaders for the three-month period January 2, 2019 to March 29, 2019 with their contribution to total traded value displayed as a percentage were:

BISX Q1 Statistical Report 2019
BISX released their Q1 Statistical Report for 2019. The Quarterly Statistical Report can be viewed in the BISX News Section on the website.