ARAWAK PORT DEVELOPMENT COMPANY LIMITED SUCCESSFULLY LISTED ON BISX
PRESS RELEASE – FOR IMMEDIATE PUBLICATION
Wednesday, April 18, 2012
The Bahamas International Securities Exchange (BISX) is pleased to announce that effective today the listing application submitted by the Arawak Port Development Company Limited has been formally approved by the BISX Listing Committee. Therefore, the company has been added to the Official Roster of companies listed on the Exchange. The ordinary shares (the “Shares”) will trade through the BISX Automated Trading System (BATS) under the symbol “APD”.
The listing of APD on BISX is the culmination of an effort that began in December 2011 with APD offering 1 million shares to the Bahamian investing public. This 1 million was combined with the 4 million shares already owned by the founding shareholders of APD and results in a total of 5 million APD shares issued and outstanding. APD will list these 5 million shares on BISX at an opening price of $10.00 and commence trading on Monday, April 23, 2012. As a result, APD will add $50 million in market capitalization to the Exchange.
Prior to submitting its application for listing to BISX, APD’s offering memorandum was reviewed and registered by the Securities Commission of The Bahamas in compliance with the Securities Industry Act, 1999. The offering memorandum was also reviewed by BISX to ensure that the offering memorandum met the disclosure requirements detailed in the BISX Rules.
Commenting on this latest listing, Keith Davies, the BISX Chief Executive Officer noted: “We are excited to add APD to the Exchange. What is most interesting about this share offering and listing is that this is one of the first times that Bahamians have been able to invest in a company that is still in the pre-operation stage of its development. The success of this offering should also illustrate the fact that Bahamians are willing to support and invest in strong companies based on their plans and future prospects.”
NOTE: Attached to this message is the BISX Formal Trading Notice for the Arawak Port Development Company Limited Shares. This notice advises the public of the securities to be listed on the Exchange and the trading symbol of the listed securities.
For additional information please contact:
Mrs. Elude Michel-Sturrup
Bahamas International Securities Exchange
info@bisxbahamas.com
Telephone: (242) 323-2330
Facsimile: (242) 323-2320
Attachments
BISX 2011 Annual Summary
BISX PRESS RELEASE
FOR IMMEDIATE PUBLICATION
JANUARY TO DECEMBER 2011 STATISTICAL REPORT
BISX is pleased to announce its BISX All-Share Index and trading statistics for the twelve month period ending December 31, 2011 with comparison to the same period of 2010.
BISX ALL SHARE INDEX
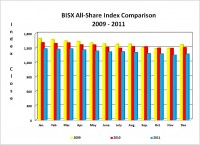
For the twelve month period ending December 31, 2011 the BISX All-Share Index closed at 1,364.99 this represents a year to date decrease of 134.52 or 8.97%. By comparison for the year ending December 31, 2010, the BISX All-Share Index closed at 1,499.51. This represented a year to date decrease of 65.87 or 4.21%. For the three month period from October 1 to December 31, 2011, the Index experienced a decrease of 11.15 or 0.81% from 1,376.14 to 1,364.99. By comparison, for the three month period from October 1 to December 31, 2010, the Index experienced a decrease of 17.26 or 1.14% from 1,516.77 to 1,499.51. The BISX All-Share Index is a market capitalization weighted index comprised of all primary market listings excluding debt securities.
As at December 31, 2011 the market was comprised of 25 primary market listings with a market capitalization of $2.905 Billion. The primary market securities traded over BISX includes 19 common share listings, 2 preference share listing and 4 tranches of debt.
COMPARISON OF BISX ALL SHARE INDEX TO INTERNATIONAL INDICES
Over the 12 month period January 1 to December 31, 2011, many international equity indices have experienced declines as indicated by the chart below:
Closing Date
MSCI Emerging Market Index
S&P 500 Index
FTSE 100 Index
BISX All Share Index
Dec 31, 2010
1,151.38
1,257.64
5,899.90
1,499.51
Dec 30, 2011
916.387
1,257.60
5,572.30
1,364.99
Percentage Change (+/-)
-20.41%
0.00%
-5.55%
-8.97%
The MSCI Emerging Markets Index is a free float-adjusted market capitalization index designed to measure equity market performance of emerging markets. http://www.mscibarra.com/index.jsp Standard &Poor’s (S&P) 500 Index is a market capitalization weighted index made up of 500 large cap U.S. companies. www.standardandpoors.com The FTSE 100 Index is a market capitalization index representing the performance of 100 of the largest UK domiciled companies. www.ftse.com
TRADING VOLUMES AND VALUES
Trading Volume for the twelve month period ending December 31, 2011 was 2,899,465 shares for a value of $15,015,550.70. For the three month period from October 1 to December 31, 2011, 840,608 shares traded for a value of $5,179,938.36.
By comparison, trading volume for the twelve month period ending December 31, 2010 was 10,859,846 shares for a value of $110,226,124.06. The trading volume for the twelve month period ending December 31, 2010 includes a 5,954,600 share trade in Cable Bahamas Limited (CAB) for a value of approximately $80,000,000 which was carried out in January 2010 as well as a 1,073,917 share trade in ICD Utilities Limited for a value of approximately $8,000,000 which was carried out in December 2010.
Removing these block trades from the twelve month trading statistics results in 3,831,329 shares trading for a value of $22,308,861.06. For the three month period from October 1 to December 31, 2010 a total of 2,079,704 shares traded for a value of $13,854,125.63.
AVERAGE DAILY VOLUME AND VALUE
For the twelve month period ending December 31, 2011 average daily trading volume was 11,451 shares for an average daily trading value of $59,674. During this period, December saw the highest daily trading volume and value with 20,881 shares trading for $131,707. By comparison, for the twelve month period ending December 31, 2010, excluding the CAB and ICD transactions, the average daily trading volume was 15,234 shares which resulted in an average daily trading value of $89,019.44. During this twelve month period, April 2010 saw the highest average daily trading volume and value with 48,775 shares and $283,409 trading, respectively.
Month – Avg. vol. / day (2011)- Avg. vol. / day (2010) – Avg. val. / day (2011)- Avg. val. / day (2010)
January – 6,505 – 9,182 – $29,299 – $82,195
February – 8,122 – 5,365 – $47,704 – $80,479
March – 15,208 – 18,226 – $74,728 – $90,705
April – 18,379 – 48,775 – $113,986 – $283,408
May – 4,510 – 8,763 – $21,907 – $64,839
June – 7,865 – 12,158 – $51,941 – $50,088
July – 3,346 – 14,936 – $16,246 – $81,520
August – 18,799 – 11,430 – $56,717 – $36,721
September – 15,014 – 6,657 – $59,892 – $21,813
October – 5,585 – 17,535 – $24,562 – $87,493
November – 13,200 – 11,038 – $87,403 – $77,876
December – 20,881 – 18,739 – $131,707 – $111,089
Average for 12 month period – 11,451 – 15,234 – $59,674 – $89,019
SHARE VOLUME AND VALUE LEADERS (TWELVE MONTH PERIOD)
The top five share volume leaders on BISX for the twelve month period ending December 31, 2011 with their contribution to total traded volume displayed as a percentage were:
SYMBOL – TRADE VOLUME – % OF VOLUME
CBL – 1,006,022.00 – 34.7%
AML – 386,188.00 – 13.3%
CHL – 303,702.00 – 10.5%
BOB – 220,406.00 – 7.6%
FCLB – 199,732.00 – 6.9%
The top five share value leaders for the twelve month period ending December 31, 2011 with their contribution to total traded value displayed as a percentage were:
SYMBOL – TRADE VALUE – % OF TRADE VALUE
CBL – $ 6,777,379.09 – 45.1%
CAB – $ 1,307,301.12 – 8.7%
BOB – $ 1,154,863.13 – 7.7%
FIN – $ 1,055,540.75 – 7.0%
FCL – $ 1,015,927.09 – 6.8%
SHARE VOLUME AND VALUE LEADERS (THREE MONTH PERIOD)
The top five share volume leaders on BISX for the three month period from October 1 to December 31, 2011 with their contribution to total traded volume displayed as a percentage were:
SYMBOL – TRADE VOLUME – % OF VOLUME
CBL – 475,179 – 56.5%
FIN – 89,223 – 10.6%
CHL – 67,962 – 8.1%
BOB – 64,448 – 7.7%
CAB – 54,068 – 6.4%
The top five share value leaders for the three month period from October 1 to December 31, 2011 with their contribution to total traded value displayed as a percentage were:
SYMBOL – TRADE VALUE – % OF TRADE VALUE
CBL – $ 3,143,868.16 – 60.7%
CAB – $ 454,703.96 – 8.8%
FIN – $ 431,672.48 – 8.3%
BOB – $ 266,404.48 – 5.1%
FBB15 – $ 188,000.00 – 3.6%
For Additional Information Contact:
Holland Grant
BISX
Tel: 242-323-2330
Fax: 242-323-2320
Email: info@bisxbahamas.com
Bahamas International Securities Exchange
Suite 201 Fort Nassau Centre
British Colonial Hilton
P. O. Box EE-15672, Nassau, Bahamas
Attachments
- « Previous Page
- 1
- …
- 31
- 32
- 33
- 34
- 35
- …
- 44
- Next Page »