FIDELITY BANK (BAHAMAS) LIMITED SERIES E NOTES LISTED ON THE BAHAMAS INTERNATIONAL SECURITIES EXCHANGE
Tuesday, 6 August 2013
The Bahamas International Securities Exchange (BISX) announced today that Fidelity Bank (Bahamas) Limited has successfully completed the listing process for their Series E Redeemable 6% Fixed Rate Notes due 2018 (the “Notes”) which are now listed on the Exchange under the symbol FBB18. The Notes have been added to the roster of securities listed on the Exchange and will trade through the BISX Automated Trading System (BATS).
CEO of Fidelity Bank, Mr. Anwer Sunderji commented: “Fidelity is pleased to have been able to issue and list $10m in new Series E Notes as its seeks to both finance its expansion and add to its growing base of investors. Through its Note offerings, Fidelity seeks to create unique investment opportunities through which to enable Bahamian investors to diversify their Bahamian dollar investment portfolios.”
BISX is able to list the secondary issues of public companies, the first company to take advantage to this was Fidelity Bank (Bahamas) Limited in September 2008 with the listing of four Medium Term Notes on BISX. Since that listing the number of secondary issues listed on BISX has expanded to 7 issues from 4 companies. These securities have seen high liquidity as evidenced by their high trading volumes, and the security of trading over an organized exchange. FBB18 will become the eighth secondary issue to have been listed on the Exchange.
Speaking about the FBB18 listing, Keith Davies, the BISX Chief Executive Officer stated: “Fidelity Bank (Bahamas) Limited has a long history with the Exchange, and we are happy to welcome this new issue from them. They have shown belief in our secondary issue listing facility that we have truly appreciated. We believe the fact that these new notes were listed on BISX speaks to the value that issuers receive from these listings.”
Speaking further, Mr. Davies noted: “Issuers benefit from a broader base of investors and a centralized location for the trading of their securities on the Exchange. National Stock Exchanges only thrive in a country when all market participants buy into the benefits that accrue from a nation having a regulated securities Exchange. Fidelity and BISX have both benefited from the listing of these notes, but as Anwer noted, I believe that Bahamian investors benefited the most from the ability to trade secondary issues over a regulated exchange.”
NOTE: Attached to this message is the BISX Formal Trading Notice for the Fidelity Bank (Bahamas) Limited Series E Redeemable 6% Fixed Rate Notes due 2018. This notice advises the public of the security to be listed on the Exchange and the trading symbol of the listed security.
Attachments
BISX Q1, 2013 Statistical Report
BISX PRESS RELEASE FOR IMMEDIATE PUBLICATION
JANUARY TO MARCH 2013 STATISTICAL REPORT
BISX is pleased to announce its BISX All-Share Index and trading statistics for the three month period ending March 31, 2013 with comparison to the same period of 2012.
BISX ALL SHARE INDEX
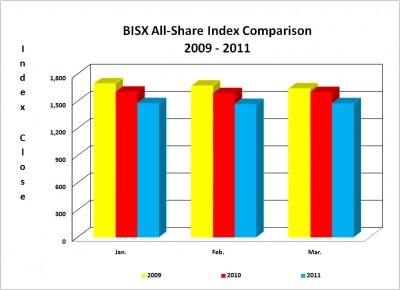
For the three month period ending March 31, 2013 the BISX All-Share Index closed at 1389.83. This represents a year to date increase of 43.57 or 3.24%. By comparison, for the three month period ending March 31, 2012, the BISX All Share Index closed at 1308.85, which represented a year to date decrease of 56.14 or -4.11. The BISX All-Share Index is a market capitalization weighted index comprised of all primary market listings excluding debt securities.
As at March 31, 2013 the market was comprised of 27 primary market listings with a market capitalization of $2.963 Billion. The primary market securities traded over BISX include 20 common share listings, 3 preference share listing and 4 tranches of debt.
COMPARISON OF BISX ALL SHARE INDEX TO INTERNATIONAL INDICES
Over the 3 month period January 1 to March 31, 2013, some international equity markets have experienced increases as indicated by the chart below:
Closing Date * MSCI Emerging Market * S&P 500 * FTSE 100 * BISX All Share
Dec 31, 2012 * 1055.20 * 1,426.19 * 5,897.80 * 1,346.26
Mar 28, 2013 * 1,032.62 * 1,569.19 * 6,411.70 * 1,389.83
Percentage Change * -2.14% * 10.03% * 8.71% * 3.24%
TRADING VOLUMES AND VALUES
Trading Volume for the three month period ending March 31, 2013 was 635,248 shares for a value of $3,760,439.21. By comparison, trading volume for the three month period ending March 31, 2012 was 1,148,910 shares for a value of $5,287,732.35.
AVERAGE DAILY VOLUME AND VALUE
For the three month period ending March 31, 2013, the average daily trading volume was 10,241 shares which resulted in an average daily trading value of $60,700. During this three month period, February 2013 saw the highest average daily trading volume and value with 13,957 shares with a value of $82,753 trading, respectively. By comparison, the three month period ended March 31, 2012 saw an average daily trading volume of 17,817 shares which resulted in an average daily trading value of $81,602.
Month * Avg. volume (2013) * Avg. volume (2012)* Avg. value (2013)* Avg. value (2012)
January * 10,384 * 10,678 * $59,195 * $27,797
February * 13,957 * 16,307 * $82,753 * $70,231
March * 6,383 * 26,464 * $40,153 * $141,779
Average for 3 month period * 10,241 * 17,817 * $60,700 * $81,602
SHARE VOLUME AND VALUE LEADERS (THREE MONTH PERIOD)
The top five share volume leaders on BISX for the three month period ending March 31, 2013 with their contribution to total traded volume displayed as a percentage were:
SYMBOL * TRADE VOLUME * % OF VOLUME
CBL * 176,570 * 27.8%
AML * 99,042 * 15.6%
CHL * 86,576 * 13.6%
BWL * 49,744 * 7.8%
FCL * 41,400 * 6.5%
The top five share value leaders for the three month period ending March 31, 2013 with their contribution to total traded value displayed as a percentage were:
SYMBOL * TRADE VALUE * % OF TRADE VALUE
CBL * $ 1,140,476.92 * 30.3%
FBB15 * $ 583,000.00 * 15.5%
CAB * $ 350,100.65 * 9.3%
CBB * $ 308,233.00 * 8.2%
FCL * $ 237,944.65 * 6.3%
For Additional Information Contact:
Mrs. Elude Michel-Sturrup
Tel: 242-323-2330
Fax: 242-323-2320
Email: info@bisxbahamas.com
Attachments
Royal Fidelity Successfully Lists 3 Mutual Funds
FOR IMMEDIATE PUBLICATION
BISX PRESS RELEASE FOR IMMEDIATE PUBLICATION
The Bahamas International Securities Exchange (BISX) is pleased to announce that Royal Fidelity Capital Markets a BISX Broker-Dealer Member has submitted an application to list three series of the Royal Fidelity Bahamas Opportunities Fund Limited mutual fund on BISX, using the Exchange’s mutual fund listing facility. This fund was approved for listing by the BISX Listing Committee and will now have its information disseminated via the BISX Website.
The Royal Fidelity Bahamas Opportunities Fund (the umbrella fund) is an umbrella fund created to market separate mutual fund sub-funds to different types of investors through the use of different series. The umbrella fund offers three sub-funds, each sub-fund has three series, and each sub-fund will list the series that serves retail investors. The three retail series to be listed will have their Net Asset Value and other information disseminated by BISX.
The three series are:
• Royal Fidelity Targeted Equity Fund (Class A, Series 1 Shares) seeks a high total return on investment through investments in Bahamian Dollar equity securities, money market instruments or investment funds. This series takes the place of the Royal Fidelity Growth and Income Fund a stand-alone mutual fund previously listed on BISX.
• Royal Fidelity Secure Balanced Fund (Class B, Series 1 Shares) seeks to provide investors with the long-term growth potential of local equities coupled with a steady rate of fixed return and preservation of capital through allocation to local fixed income securities. The Fund will attempt to achieve this objective primarily through a balanced allocation to the equity portfolio of Targeted Equity Trading Company Limited and the fixed income portfolio of Prime Income Trading Company Limited.
• Royal Fidelity Prime Income Fund (Class C, Series 1 Shares) seeks a high and stable rate of return in excess of the Benchmark, together with long-term preservation of capital. The Investment Manger will be responsible for managing the assets of the portfolio on a daily basis. This series takes the place of the Royal Fidelity Prime Income Fund a stand-alone mutual fund previously listed on BISX.
Commenting of the addition of the three mutual fund series to the Exchange, Mr. Davies stated, “We are pleased with the addition of these three mutual fund series from Royal Fidelity. Offering investors variety and choice in investments is a goal of the Exchange and this is achieved with these new listings.”
The Investment Manager of these mutual funds is Royal Fidelity Merchant Bank & Trust Limited, Royal Fidelity Merchant Bank & Trust also serves as administrator for these funds.
“We’re very pleased to be able to list these three funds on the Exchange,” said Joseph Euteneuer, Royal Fidelity’s Assistant Vice President for Mutual Funds. “We can now offer Bahamian investors a complete family of investment funds to match any risk appetite: from fixed income for the very conservative, to a balanced combination of fixed income and equity for the moderate, to full equity for those looking for the potential for higher gain.”
For Additional Information Contact:
Mrs. Elude Michel-Sturrup
Tel: 242-323-2330
Fax: 242-323-2320
Email: info@bisxbahamas.com
Attachments
BISX 2012 Statistical Report
BISX PRESS RELEASE
FOR IMMEDIATE PUBLICATION
JANUARY TO DECEMBER 2012 STATISTICAL REPORT
BISX is pleased to announce its BISX All-Share Index and trading statistics for the twelve month period ending December 31, 2012 with comparison to the same period of 2011.
BISX ALL SHARE INDEX
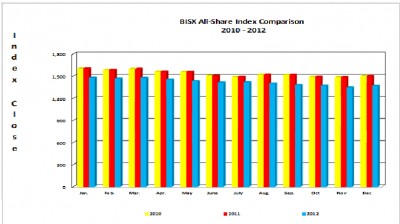
For the twelve month period ending December 31, 2012 the BISX All-Share Index closed at 1346.26. This represents a year to date decrease of 18.73 or -1.37%. For the year ending December 31, 2011, the BISX All Share Index closed at 1364.99, which represented a year to date decrease of 134.52 or – 8.97%. For the three month period from October 1 to December 31, 2012, the Index experienced an increase of 38.25 or 2.92% from 1308.01 to 1346.26. By comparison, for the three month period from October 1 to December 31, 2011, the Index experienced a decrease of 11.15 or -0.81% from 1376.14 to 1364.99. The BISX All-Share Index is a market capitalization weighted index comprised of all primary market listings excluding debt securities.
As at December 31, 2012 the market was comprised of 27 primary market listings with a market capitalization of $2.87 Billion. The primary market securities traded over BISX include 20 common share listings, 3 preference share listing and 4 tranches of debt.
COMPARISON OF BISX ALL SHARE INDEX TO INTERNATIONAL INDICES
Over the 12 month period January 1 to December 31, 2012, some international equity markets have experienced increases as indicated by the chart below:
Closing Date * MSCI Emerging Markets Index * S&P 500 Index * FTSE 100 Index *BISX ALL Share Index
31-Dec-2011 * 916.39* 1,258.86 * 5,572.30 * 1,364.99
31-Dec-2012 * 1055.20 * 1,426.19 * 5,897.80 * 1,346.26
Percentage * 15.15% * 13.29% * 5.84% * -1.37% Change (+/-)
TRADING VOLUMES AND VALUES
Trading Volume for the twelve month period ending December 31, 2012 was 4,080,393 shares for a value of $18,892,061.93. For the three month period from October 1 to December 31, 2012, 679,075 shares traded for a value of $3,732,476.83.
By comparison, Trading Volume for the twelve month period ending December 31, 2011 was 2,899,465 shares for a value of $15,015,550.70. For the three month period from October 1 to December 31, 2011, 840,608 shares traded for a value of $5,179,938.36.
AVERAGE DAILY VOLUME AND VALUE
For the twelve month period ending December 31, 2012, the average daily trading volume was 16,146 shares which resulted in an average daily trading value of $74,433. During this twelve month period, May 2012 saw the highest average daily trading volume and value with 41,072 shares and $149,795 trading, respectively. By comparison, the twelve month period ended December 31, 2011 saw an average daily trading volume of 11,451 shares which resulted in an average daily trading value of $59,674.
Month Avg. volume / Avg. volume / Avg. value / Avg. value / trading trading day (2012) trading day (2011) trading day (2012) day (2011)
January * 10,678 * 6,505 * $27,797 * $29,299
February * 16,307 * 8,122 * $70,231 * $47,704
March * 26,464 * 15,208 * $141,779 * $74,728
April * 10,751 * 18,379 * $51,410 * $113,986
May * 41,072 * 4,510 * $149,795 * $21,907
June * 29,094 * 7,865 * $133,515 * $51,941
July * 8,382 * 3,346 * $48,495 * $16,246
August * 9,324 * 18,799 * $41,692 * $56,717
September * 9,613 * 15,014 * $52,253 * $59,892
October * 8,770 * 5,585 * $48,160 * $24,562
November * 10,744 * 13,200 * $53,663 * $87,403
December * 12,548 * 20,881 * $74,401 * $131,707
Average for * 16,146 * 11,451 * $74,433 * $59,674
12 month period
SHARE VOLUME AND VALUE LEADERS (TWELVE MONTH PERIOD)
The top five share volume leaders on BISX for the twelve month period ending December 31, 2012 with their contribution to total traded volume displayed as a percentage were:
SYMBOL * TRADE VOLUME * % OF VOLUME
CBL * 1,524,750 * 37.37%
FCLB * 360,450 * 8.83%
AML * 323,323 * 7.92%
FCL * 295,229 * 7.24%
FBB * 260,070 * 6.37%
The top five share value leaders for the twelve month period ending December 31, 2012 with their contribution to total traded value displayed as a percentage were:
SYMBOL * TRADE VALUE * % OF TRADE VALUE
CBL * $9,656,140.07 * 51.1%
CAB * $1,675,761.94 * 8.9%
FCL * $1,486,527.73 * 7.9%
FIN * $1,130,143.30 * 6.0%
CBB * $663,400.98 * 3.5%
SHARE VOLUME AND VALUE LEADERS (THREE MONTH PERIOD)
The top five share volume leaders on BISX for the three month period from October 1 to December 31, 2012 with their contribution to total traded volume displayed as a percentage were:
SYMBOL * TRADE VOLUME * % OF VOLUME
CBL * 383,831 * 56.52%
CHL * 52,063 * 7.67%
FIN * 44,146 * 6.50%
AML * 43,941 * 6.47%
BOB * 39,340 * 5.79%
The top five share value leaders for the three month period from October 1 to December 31, 2012 with their contribution to total traded value displayed as a percentage were:
SYMBOL * TRADE VALUE * % OF TRADE VALUE
CBL * $2,416,929.50 * 64.8%
CAB * $287,001.90 * 7.7%
FIN * $239,625.05 * 6.4%
BOB * $212,592.20 * 5.7%
CHL * $121,071.82 * 3.2%
For Additional Information Contact:
Mrs. Elude Michel-Sturrup
Tel: 242-323-2330
Fax: 242-323-2320
Email: info@bisxbahamas.comBISX Annual Summary (with graphs)
Attachments
- « Previous Page
- 1
- …
- 22
- 23
- 24
- 25
- 26
- …
- 44
- Next Page »