BISX PRESS RELEASE
FOR IMMEDIATE PUBLICATION
JANUARY TO DECEMBER 2012 STATISTICAL REPORT
BISX is pleased to announce its BISX All-Share Index and trading statistics for the twelve month period ending December 31, 2012 with comparison to the same period of 2011.
BISX ALL SHARE INDEX
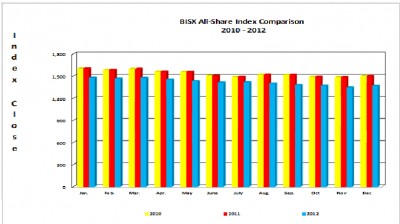
For the twelve month period ending December 31, 2012 the BISX All-Share Index closed at 1346.26. This represents a year to date decrease of 18.73 or -1.37%. For the year ending December 31, 2011, the BISX All Share Index closed at 1364.99, which represented a year to date decrease of 134.52 or – 8.97%. For the three month period from October 1 to December 31, 2012, the Index experienced an increase of 38.25 or 2.92% from 1308.01 to 1346.26. By comparison, for the three month period from October 1 to December 31, 2011, the Index experienced a decrease of 11.15 or -0.81% from 1376.14 to 1364.99. The BISX All-Share Index is a market capitalization weighted index comprised of all primary market listings excluding debt securities.
As at December 31, 2012 the market was comprised of 27 primary market listings with a market capitalization of $2.87 Billion. The primary market securities traded over BISX include 20 common share listings, 3 preference share listing and 4 tranches of debt.
COMPARISON OF BISX ALL SHARE INDEX TO INTERNATIONAL INDICES
Over the 12 month period January 1 to December 31, 2012, some international equity markets have experienced increases as indicated by the chart below:
Closing Date * MSCI Emerging Markets Index * S&P 500 Index * FTSE 100 Index *BISX ALL Share Index
31-Dec-2011 * 916.39* 1,258.86 * 5,572.30 * 1,364.99
31-Dec-2012 * 1055.20 * 1,426.19 * 5,897.80 * 1,346.26
Percentage * 15.15% * 13.29% * 5.84% * -1.37% Change (+/-)
TRADING VOLUMES AND VALUES
Trading Volume for the twelve month period ending December 31, 2012 was 4,080,393 shares for a value of $18,892,061.93. For the three month period from October 1 to December 31, 2012, 679,075 shares traded for a value of $3,732,476.83.
By comparison, Trading Volume for the twelve month period ending December 31, 2011 was 2,899,465 shares for a value of $15,015,550.70. For the three month period from October 1 to December 31, 2011, 840,608 shares traded for a value of $5,179,938.36.
AVERAGE DAILY VOLUME AND VALUE
For the twelve month period ending December 31, 2012, the average daily trading volume was 16,146 shares which resulted in an average daily trading value of $74,433. During this twelve month period, May 2012 saw the highest average daily trading volume and value with 41,072 shares and $149,795 trading, respectively. By comparison, the twelve month period ended December 31, 2011 saw an average daily trading volume of 11,451 shares which resulted in an average daily trading value of $59,674.
Month Avg. volume / Avg. volume / Avg. value / Avg. value / trading trading day (2012) trading day (2011) trading day (2012) day (2011)
January * 10,678 * 6,505 * $27,797 * $29,299
February * 16,307 * 8,122 * $70,231 * $47,704
March * 26,464 * 15,208 * $141,779 * $74,728
April * 10,751 * 18,379 * $51,410 * $113,986
May * 41,072 * 4,510 * $149,795 * $21,907
June * 29,094 * 7,865 * $133,515 * $51,941
July * 8,382 * 3,346 * $48,495 * $16,246
August * 9,324 * 18,799 * $41,692 * $56,717
September * 9,613 * 15,014 * $52,253 * $59,892
October * 8,770 * 5,585 * $48,160 * $24,562
November * 10,744 * 13,200 * $53,663 * $87,403
December * 12,548 * 20,881 * $74,401 * $131,707
Average for * 16,146 * 11,451 * $74,433 * $59,674
12 month period
SHARE VOLUME AND VALUE LEADERS (TWELVE MONTH PERIOD)
The top five share volume leaders on BISX for the twelve month period ending December 31, 2012 with their contribution to total traded volume displayed as a percentage were:
SYMBOL * TRADE VOLUME * % OF VOLUME
CBL * 1,524,750 * 37.37%
FCLB * 360,450 * 8.83%
AML * 323,323 * 7.92%
FCL * 295,229 * 7.24%
FBB * 260,070 * 6.37%
The top five share value leaders for the twelve month period ending December 31, 2012 with their contribution to total traded value displayed as a percentage were:
SYMBOL * TRADE VALUE * % OF TRADE VALUE
CBL * $9,656,140.07 * 51.1%
CAB * $1,675,761.94 * 8.9%
FCL * $1,486,527.73 * 7.9%
FIN * $1,130,143.30 * 6.0%
CBB * $663,400.98 * 3.5%
SHARE VOLUME AND VALUE LEADERS (THREE MONTH PERIOD)
The top five share volume leaders on BISX for the three month period from October 1 to December 31, 2012 with their contribution to total traded volume displayed as a percentage were:
SYMBOL * TRADE VOLUME * % OF VOLUME
CBL * 383,831 * 56.52%
CHL * 52,063 * 7.67%
FIN * 44,146 * 6.50%
AML * 43,941 * 6.47%
BOB * 39,340 * 5.79%
The top five share value leaders for the three month period from October 1 to December 31, 2012 with their contribution to total traded value displayed as a percentage were:
SYMBOL * TRADE VALUE * % OF TRADE VALUE
CBL * $2,416,929.50 * 64.8%
CAB * $287,001.90 * 7.7%
FIN * $239,625.05 * 6.4%
BOB * $212,592.20 * 5.7%
CHL * $121,071.82 * 3.2%
For Additional Information Contact:
Mrs. Elude Michel-Sturrup
Tel: 242-323-2330
Fax: 242-323-2320
Email: info@bisxbahamas.comBISX Annual Summary (with graphs)