FOR IMMEDIATE PUBLICATION
January to September 2010 Statistical Report
BISX is pleased to announce its BISX All-Share Index and trading statistics for the nine month period ending September 30, 2010 with comparison to the same period of 2009.
BISX ALL SHARE INDEX
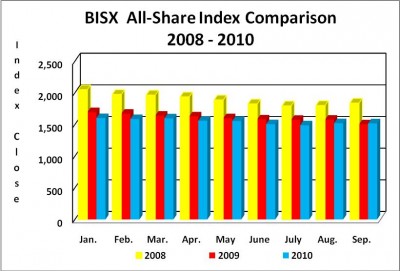
For the nine month period ending September 30, 2010 the BISX All-Share Index closed at 1,516.77. This represents a year to date decrease of 48.61 or -3.11%. For the comparable nine month period ending September 30, 2009 the BISX All Share Index closed at 1501.78, which represented a year to date decrease over the 2009 nine month period of 210.58 points or -12.30%. For the three month period from July 1 to September 30, 2010, the Index experienced an increase of 11.96 or 0.8% from 1,504.81 to 1,516.77. The BISX All-Share Index is a market capitalization weighted index comprised of all primary market listings excluding debt securities.
As at September 30, 2010 the market was comprised of 23 primary market listings with a market capitalization of $2.938 Billion. The primary market securities traded over BISX include 18 common share listings, 1 preference share listing and 4 tranches of debt. (Note: Freeport Concrete Company Limited was removed from the roster of BISX listed issuers on Wednesday, July 28, 2010.)
COMPARISON OF BISX ALL SHARE INDEX TO INTERNATIONAL INDICES
Over the 9 month period January to September 30, 2010, some international equity markets have experienced increases as indicated by the chart below:
- Closing Date – 31-Dec-09
MSCI Emerging Market Index – 989.47
S&P 500 Index – 1,115.10
FTSE 100 Index – 5,412.90
BISX All Share Index – 1,565.38 - Closing Date – 30-Sep-10
MSCI Emerging Market Index – 1075.53
S&P 500 Index – 1,141.20
FTSE 100 Index – 5,548.60
BISX All Share Index – 1,516.77 - Percentage Change (+/-)
MSCI Emerging Market Index – 8.70%
S&P 500 Index – 2.34%
FTSE 100 Index – 2.51%
BISX All Share Index – (3.11%)
TRADING VOLUMES AND VALUES
Trading volume for the nine month period ending September 30, 2010 was 8,780,142 shares for a value of $96,371,998.43. The trading volume for the nine month period ending September 30, 2010 includes a 5,954,600 share trade in Cable Bahamas Limited (CAB) for a value of approximately $80,000,000 which was carried out in January 2010. Removing this transaction from the nine month trading statistics results in 2,825,542 shares trading for a value of $16,401,720.43. By comparison for the nine month period of 2009 2,592,965 shares traded for a value of $14,402,520.74.
For the three month period from July 1, 2010 to September 30, 2010 700,154 shares traded for a value of $2,962,987.46. This compares to the July 1, 2009 to September 30, 2009 period where 937,327 shares traded for a value of $5,682,644.38. This represents a decrease of 25.3% in share volume traded, and a decrease of 47.9% in share value traded in 2010 compared to 2009.
AVERAGE DAILY VOLUME AND VALUE
For the nine month period ending September 30, 2010, excluding the CAB transaction, the average daily trading volume was 15,055 shares which resulted in an average daily trading value of $87,974.76. During this nine month period, April 2010 saw the highest average daily trading volume and value with 48,775 shares and $283,409 trading, respectively. By comparison, the nine month period ended September 30, 2009 saw an average daily trading volume of 13,672 shares which resulted in an average daily trading value of $75,595.37.
Month
Avg. Vol Day (2010)
Avg. Vol Day (2009)
Avg. Val. Day (2010)
Avg. Val Day (2009)


January
9,182
13,390
$82,195.00
$67,447.05


February
5,365
5,309
$80,479.66
$34,372.94


March
18,226
10,498
$90,705.74
$56,864.44


April
48,775
6,314
$283,408.83
$34,562.62


May
8,763
37,157
$64,839.14
$203,639.57


June
12,158
6,536
$50,088.60
$19,866.42


July
14,936
7,479
$81,520.04
$53,152.28


August
11,430
13,574
$36,721.90
$58,335.56


September
6,657
22,786
$21,813.94
$152,117.41


Average for 9 month period
15,055
13,672
$87,974.76
$75,595.37
SHARE VOLUME AND VALUE LEADERS (NINE MONTH PERIOD)
The top five share volume leaders on BISX for the nine month period ending September 30, 2010 with their contribution to total traded volume displayed as a percentage in brackets were:
SYMBOL TRADE VOLUME % OF VOLUME
CAB – 6,105,663.00 – [69.5%]
CBL – 886,295.00 – [10.1%]
FCL – 434,651.00 – [5.0%]
CHL – 424,388.00 – [4.8%]
DHS – 214,557.00 – [2.4%]
The top five share value leaders for the nine month period ending September 30, 2010 with their contribution to total traded value displayed as a percentage in brackets were:
SYMBOL TRADE VALUE % OF TRADE VALUE
CAB – $ 83,312,427.36 – [86.4%]
CBL – $ 3,038,414.98 – [3.2%]
FCL – $ 2,113,555.42 – [2.2%]
FBB15 – $ 1,752,000.00 – [1.8%]
BWL – $ 1,408,819.66 – [1.5%]
SHARE VOLUME AND VALUE LEADERS (THREE MONTH PERIOD)
The top five share volume leaders on BISX for the three month period from July 1, to September 30, 2010 with their contribution to total traded volume displayed as a percentage in brackets were:
SYMBOL TRADE VOLUME % OF VOLUME
CHL – 244,259.00 – [34.9%]
CBL – 233,879.00 – [33.4%]
FCL – 81,878.00 – [11.7%]
DHS – 67,200.00 – [9.6%]
BOB – 15,479.00 – [2.2%]
The top five share value leaders for the three month period from July 1, to September 30, 2010 with their contribution to total traded value displayed as a percentage in brackets were:
SYMBOL TRADE VALUE % OF TRADE VALUE
CBL – $ 1,463,768.73 – [49.4%]
CHL – $ 611,707.50 – [20.6%]
FCL – $ 394,142.21 – [13.3%]
DHS – $ 130,923.00 – [4.4%]
CAB – $ 128,147.20 – [4.3%]
For Additional Information Contact
Holland Grant
BISX Listing Manager
Tel: 242-323-2330
Fax: 242-323-2320
Email: info@bisxbahamas.com