BISX PRESS RELEASE
FOR IMMEDIATE PUBLICATION
JANUARY TO SEPTEMBER 2012 STATISTICAL REPORT
BISX is pleased to announce its BISX All-Share Index and trading statistics for the nine month period ending September 30, 2012 with comparison to the same period of 2011.
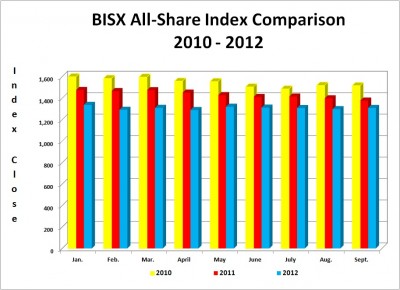
BISX ALL SHARE INDEX
For the nine month period ending September 30, 2012 the BISX All-Share Index closed at 1,308.01, this represents a year to date decrease of 56.98 or 4.17%. By comparison for the nine month period ending September 30, 2011 the BISX All-Share Index closed at 1,376.14. This represented a year to date decrease of 123.37 or 8.23%.
As at September 30, 2012 the market was comprised of 27 primary market listings with a market capitalization of $2.788 Billion. The primary market securities traded over BISX include 20 common share listings, 3 preference share listings and 4 tranches of debt.
COMPARISON OF BISX ALL SHARE INDEX TO INTERNATIONAL INDICES
Over the 9 month period January 1 to September 30, 2012, some international equity markets have experienced increases as indicated by the chart below:
TRADING VOLUMES AND VALUES
Trading volume for the nine month period ending September 30, 2012 was 3,401,318 shares for a value of $15,159,585.10. By comparison, trading volume for the nine month period ending September 30, 2011 was 2,058,857 shares for a value of $9,835,612.34.
Trading volume for the three month period July 1, 2012 to September 30, 2012 was 573,406 shares for a value of $2,980,673.45. Trading volume for the three month period July 1, 2011 to September 30, 2011 was 810,822 shares for a value of $2,890,317.16.
Closing Date * MSCI Emerging Market Index * S&P 500 Index * FTSE 100 Index * BISX All Share Index
Dec 31, 2011 * 916.39 * 1,257.60 * 5,572.30 * 1,364.99
Sep 30, 2012 * 1,002.656 * 1,440.67* 5,742.10 * 1,308.01
Percentage Change (+/-) * 9.41% * 14.56% * 3.05% * -4.17%
AVERAGE DAILY VOLUME AND VALUE
During the 9 month period ended September 30, 2012, the average volume per trading day was 17,965 shares for an average value per trading day of $80,219. May saw the largest average daily trading volume and value during this period with 41,072 shares trading on an average trading day, for a value of $149,795. By Comparison, during the 9 month period ended September 30, 2011, the average volume per trading day was 10,861 shares for an average value per trading day of $52,491. August saw the largest average daily trading volume with 18,799 shares trading and April saw the highest value with an average value per trading day of $113,986.
Month * Avg. volume / trading day (2012) * Avg. volume / trading day (2011) * Avg. value / trading day (2012) * Avg. value / trading day (2011)
January * 10,678 * 6,505 * $27,797 * $29,299
February * 16,307 * 8,122 * $70,231 * $47,704
March * 26,464* 15,208 * $146,779 * $74,728
April * 10,751 * 18,379 * $51,410* $113,986
May * 41,072 * 4,510 * $149,795 * $21,907
June * 29,094 * 7,865 * $133,515 * $51,941
July * 8,382 * 3,346 * $48,495 * $16,246
August * 9,324 * 18,799 * $41,692* $56,717
September * 9,613 * 15,014 * $52,253 * $59,892
Average for period * 17,965 * 10,861 * $80,219 * $52,491
SHARE VOLUME AND VALUE LEADERS (NINE MONTH PERIOD)
The top five share volume leaders on BISX for the nine month period ending September 30, 2012 with their contribution to total traded volume displayed as a percentage were:
SYMBOL * TRADE VOLUME * % OF VOLUME
CBL * 1,140,919 * 33.5%
FCLB * 351,450 * 10.3%
FCL * 283,319 * 8.3%
AML * 279,382 * 8.2%
FBB * 243,270 * 7.2%
The top five share value leaders for the nine month period ending September 30, 2012 with their contribution to total traded value displayed as a percentage were:
SYMBOL * TRADE VALUE * % OF TRADE VALUE
CBL * $ 7,239,210.57 * 47.8%
FCL * $ 1,418,423.83 * 9.4%
CAB * $ 1,388,760.04 * 9.2%
FIN * $ 890,518.25 * 5.9%
CIB * $ 582,706.28 * 3.8%
SHARE VOLUME AND VALUE LEADERS (THREE MONTH PERIOD)
The top five share volume leaders on BISX for the three month period July 1, 2012 to September 30, 2012 with their contribution to total traded volume over the three month period displayed as a percentage were:
SYMBOL * TRADE VOLUME * % OF VOLUME
CBL * 179,754 * 31.3%
AML * 64,284 * 11.2%
CAB * 46,165 * 8.1%
FBB * 39,990 * 7.0%
FIN * 39,916 * 7.0%
The top five share value leaders for the three month period July 1, 2012 to September 30, 2012 with their contribution to total traded value over the three month period displayed as a percentage were:
SYMBOL * TRADE VALUE * % OF TRADE VALUE
CBL * $ 1,124,074.33 * 37.7%
CAB * $ 399,782.87 * 13.4%
JSJ * $ 230,095.62 * 7.7%
CIB * $ 206,676.78 * 6.9%
FIN * $ 205,752.55 * 6.9%
For additional information contact:
Mrs. Elude Michel-Sturrup
Tel: 242-323-2330
Fax: 242-323-2320
Email: info@bisxbahamas.com