JANUARY TO JUNE 2013 STATISTICAL REPORT
BISX is pleased to announce its BISX All-Share Index and trading statistics for the six month period ending June 30, 2013, with comparison to the same period of 2012 .
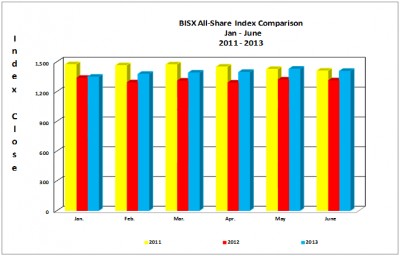
BISX ALL SHARE INDEX
For the six month period ending June 30, 2013 the BISX All-Share Index closed at 1,406.66. This represents a year to date increase of 60.40 or 4.49.%. By comparison for the six month period ending June 30, 2012 the BISX All-Share Index closed at 1,311.53. This represented a year to date decrease of 53.46 or 3.92%.
For the three month period from April 1, 2013 to June 30, 2013, the All-Share Index increased by 16.83 or 1.21%. By comparison, for the three month period from April 1, 2012 to June 30, 2012, the Index experienced a decrease of 2.68 or 0.2%. The BISX All-Share Index is a market capitalization weighted index comprised of all primary market listings excluding debt securities.
As at June 30, 2013 the market was comprised of 26 primary market listings with a market capitalization of $2.663 Billion. The primary market securities traded over BISX include 20 common share listings, 3 preference share listings and 3 tranches of debt.
COMPARISON OF BISX ALL SHARE INDEX TO INTERNATIONAL INDICES
Over the 6 month period January 1 to June 30, 2013, some international equity markets have experienced increases as indicated by the chart below:
Closing Date * MSCI Emerging Mkt Index * S&P 500 Index * FTSE 100 Index * BISX All Share Index
Dec 31, 2012 * 1,055.20 * 1,426.19 * 5,897.80 * 1,346.26
Jun 30, 2013 * 940.33 * 1,606.28 * 6,215.50 * 1,406.66
Percentage Change (+/-) * -10.89% * 12.63% * 5.39% * 4.49%
TRADING VOLUMES AND VALUES
Trading volume for the six month period ending June 30, 2013 was 1,653,674.00 shares for a value of $7,978,715.14 . Trading volume for the six month period ending June 30, 2012 was 2,827,912 shares for a value of $12,178,911.65.
Trading volume for the three month period April 1, 2013 to June 30, 2013 was 1,018,426 for a value of $4,218,275.93. By comparison, for the three month period from April 1, 2012 to June 30, 2012 1,679,002 shares traded for a value of $6,891,179.30.
AVERAGE DAILY VOLUME AND VALUE
For the six month period ending June 30, 2013 the average daily trading volume was 13,266 shares which resulted in an average daily trading value of $64,035.03 . By comparison for the six month period June 30, 2012 the average daily trading volume was 22,395 shares for an average value of $96,588.
During the three month period from April 1, 2013 to June 30, 2013, the average volume per trading day was 16,290 shares for a value of $67,369.26. By comparison, for the three month period from April 1, 2012 to June 30, 2012, the average volume per trading day was 26,972 shares for an average value of
$111,573.
Month * Avg. volume (2013) * Avg. volume(2012) * Avg. value(2013) * Avg. value
January * 10,384 * 10,678 * $59,195.24 * $27,797
February * 13,957 * 16,307 * $82,753.83 * $70,231
March * 6,383 * 26,464 * $40,153.37 * $146,779
April * 23,815 * 10,751 * $81,113.50 * $51,410
May * 14,093 * 41,072 * $72,000.46 * $149,795
June * 10,961 * 29,094 * $48,993.81 * $133,515
Average for period * 16,290 * 22,395 * $67,369.26 * $96,588
SHARE VOLUME AND VALUE LEADERS (SIX MONTH PERIOD)
The top five share volume leaders on BISX for the six month period ending June 30, 2013 with their contribution to total traded volume displayed as a percentage were:
SYMBOL * TRADE VOLUME * % OF VOLUME
CBL * $392,615.00 * 24.5%
FBB * $237,185.00 * 14.8%
CHL * $196,065.00 * 12.2%
AML * $152,948.00 * 9.5%
CHLA * $119,000.00 * 7.4%
The top five share value leaders on BISX for the six month period ending June 30, 2013 with their contribution to total traded value displayed as a percentage were:
SYMBOL * TRADE VALUE * % OF TRADE VALUE
CBL * $1,437,019.26 * 21.0%
FBB * $643,331.19 * 9.4%
CAB * $616,643.66 * 9.0%
FBB15 * $583,000.00 * 8.5%
CHL * $504,595.50 * 7.4%
SHARE VOLUME AND VALUE LEADERS (THREE MONTH PERIOD)
The top five share volume leaders on BISX for the three month period April 1, 2013 to June 30, 2013 with their contribution to total traded volume displayed as a percentage were:
SYMBOL * TRADE VOLUME * % OF VOLUME
CBL * $216,045.00 * 21.2%
FBB * $211,988.00 * 20.8%
CHLA * $110,000.00 * 10.8%
CHL * $109,489.00 * 10.8%
BOB * $54,275.00 * 5.3%
The top five share value leaders on BISX for the three month period April 1, 2013 to June 30, 2013 with their contribution to total traded value displayed as a percentage were:
SYMBOL * TRADE VALUE * % OF TRADE VALUE
CBL * $1,437,019.26 * 34.1%
FBB * $583,199.50 * 13.8%
FIN * $360,062.09 * 8.5%
CHL * $288,813.76 * 6.8%
BOB * $286,888.63 * 6.8%
For Additional Information Contact:
Cha-Nea Hepburn
Tel: 242-323-2330
Fax: 242-323-2320
Email: info@bisxbahamas.com
Publication Date: August 23, 2013