FOR IMMEDIATE PUBLICATION
JANUARY TO JUNE 2011 STATISTICAL REPORT
BISX is pleased to announce its BISX All-Share Index and trading statistics for the six month period ending June 30, 2011, with comparison to the same period of 2010.
BISX ALL SHARE INDEX
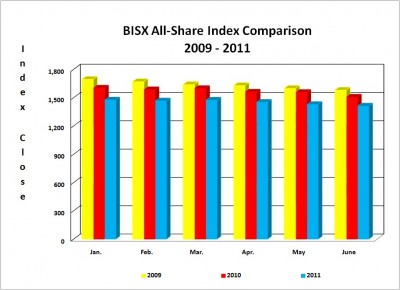
For the six month period ending June 30, 2011 the BISX All-Share Index closed at 1,410.58. This represents a year to date decrease of 88.93 or -5.93%. By comparison for the six month period ending June 30, 2010 the BISX All-Share Index closed at 1,504.81. This represented a year to date decrease of 60.57 or -3.87%.
For the three month period from April 1, 2011 to June 30, 2011, the All-Share Index declined by 62.83 or 4.26%. By comparison, for the three month period from April 1, 2010 to June 30, 2010, the Index experienced a decrease of 91.81 or -6.1% from 1,597.06 to 1,504.81. The BISX All-Share Index is a market capitalization weighted index comprised of all primary market listings excluding debt securities.
As at June 30, 2011 the market was comprised of 24 primary market listings with a market capitalization of $3.095 Billion. The primary market securities traded over BISX include 19 common share listings, 1 preference share listing and 4 tranches of debt.
COMPARISON OF BISX ALL SHARE INDEX TO INTERNATIONAL INDICES
Over the 6 month period January 1 to June 30, 2011, some international equity markets have experienced increases as indicated by the chart below:
Closing Date
MSCI Emerging Market Index
S&P 500 Index
FTSE 100 Index
BISX All Share Index
Dec 31, 2010
1,151.38
1,257.64
5,899.90
1,499.51
Jun 30, 2011
1,146.22
1,320.64
5,945.70
1,410.58
Percentage Change (+/-) -0.45%
5.01%
0.78%
-5.93%
TRADING VOLUMES AND VALUES
Trading volume for the six month period ending June 30, 2011 was 1,248,035 shares for a value of $6,945,295.18. Trading volume for the six month period ending June 30, 2010 was 8,079,988 shares for a value of $93,409,010.97. The trading volume for the six month period ending June 30, 2010 includes a 5,954,600 share trade in Cable Bahamas Limited (CAB) for a value of approximately $80,000,000 which was carried out in January 2010. Removing this transaction from these six month statistics results in 2,125,388 shares trading for a value of $13,438,732.97 during the six month period ending June 30, 2010.
Trading volume for the three month period April 1, 2011 to June 30, 2011 was 605,721 for a value of $3,686,503.49. By comparison, for the three month period from April 1, 2010 to June 30, 2010 1,406,070 shares traded for a value of $8,016,819.84.
AVERAGE DAILY VOLUME AND VALUE
For the six month period ending June 30, 2011 the average daily trading volume was 10,098 shares which resulted in an average daily trading value of $56,594. During this six month period, April 2011 saw the highest average daily trading volume and value with an average of 18,379 shares trading for an average value of $113,986.
For the six month period ending June 30, 2010, excluding the large CAB transaction, the average daily trading volume was 17,078 shares which equaled an average daily trading value of $108,619. During this six month period; April 2010 saw the highest average daily trading volume and value with 48,775 shares and $283,409 trading, respectively.
During the three month period from April 1, 2011 to June 30, 2011, the average volume per trading day was 10,251 shares for a value of $62,611. By comparison, for the three month period from April 1, 2010 to June 30, 2010, the average volume per trading day was 23,232 shares for an average value of $132,778.85.
Month
Avg. volume / trading day (2011)
Avg. volume / trading day (2010)
Avg. value / trading day (2011) Avg. value / trading day (2010)
January 6,505
9,182
$29,299 $82,195
February
8,122
5,365
$47,704 $80,480
March
15,208
18,226
$74,728 $90,706
April
18,379
48,775
$113,986
$283,409
May 4,510
8,763
$21,907 $64,839
June
7,865
12,158
$51,941 $50,089
Average for period
10,098
17,078
$56,594 $108,619
SHARE VOLUME AND VALUE LEADERS (SIX MONTH PERIOD)
The top five share volume leaders on BISX for the six month period ending June 30, 2011 with their contribution to total traded volume displayed as a percentage were:
SYMBOL
TRADE VOLUME
% OF VOLUME
CBL
446,761
35.8%
AML
152,014
12.2%
CHL
138,442
11.1%
BOB
135,863
10.9%
FCL
82,949
6.6%
The top five share value leaders for the six month period ending June 30, 2011 with their contribution to total traded value displayed as a percentage were:
SYMBOL
TRADE VALUE % OF TRADE VALUE
CBL
$3,071,689.51
44.2%
BOB
$749,206.87
10.8%
CAB
$511,709.66
7.4%
FCL
$457,092.90
6.6%
FBB15
$448,000.00
6.5%
SHARE VOLUME AND VALUE LEADERS (THREE MONTH PERIOD)
The top five share volume leaders on BISX for the three month period April 1, 2011 to June 30, 2011 with their contribution to total traded volume displayed as a percentage were:
SYMBOL
TRADE VOLUME
% OF VOLUME
CBL
239,195
39.5%
BOB
73,019
12.1%
AML
61,250
10.1%
CBB
39,894
6.6%
FCL
35,769
5.9%
The top five share value leaders for the three month period April 1, 2011 to June 30, 2011 with their contribution to total traded value displayed as a percentage were:
SYMBOL
TRADE VALUE % OF TRADE VALUE
CBL
$1,654,069.85
44.9%
BOB
$434,891.20
11.8%
CBB
$334,112.78
9.1%
CAB
$298,634.05
8.1%
FCL
$195,929.50
5.3%
For Additional Information Contact:
Holland Grant
BISX Listing Manager
Tel: 242-323-2330
Fax: 242-323-2320
Email: info@bisxbahamas.com