BISX PRESS RELEASE
FOR IMMEDIATE PUBLICATION
JANUARY TO SEPTEMBER 2009 STATISTICAL REPORT
The Bahamas International Securities Exchange (BISX) is pleased to publish its BISX All Share Index and trading statistics for the nine month period ending September 30, 2009 with comparison to the same period of 2008.
BISX ALL SHARE INDEX
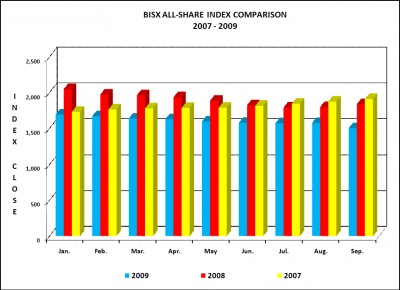
For the nine month period ending September 30, 2009 the BISX All Share Index closed at 1501.78, which represented a year to date decrease of 210.58 points or -12.30%. By comparison; for the nine month period ending September 30, 2008 the BISX All Share Index closed at 1836.61 which represented a year to date decrease of 230.14 or -11.14%.
For the three month period from July 1, 2008 – September 30, 2009 the Index experienced a decrease of 77.45 points. For the three month period from July 1, 2009 – September 30, 2008 the Index experienced a decrease of 20.33. The BISX All Share Index is a market capitalization weighted index comprised of all primary market listings excluding debt securities.
As at September 30, 2009 the market was comprised of 24 primary market listings with a market capitalization of $2.89 billion. This compares to a market capitalization at December 31, 2008 of $3.30 billion, a decline of $407 million or 12.3%. The primary market securities traded over BISX include 19 common share listings, 1 preference share listing and 4 tranches of debt.
TRADING VOLUMES AND VALUES
Trading volume for the nine month period of 2009 was 2,592,965 shares trading for a value of $14,402,520.74. During the comparable period of 2008, 3,592,161 shares traded for a value of $23,604,796.28. For the three month period from July to Sept. 30, 2009; 937,327 shares traded for a value of $5,682,644.38. By comparison, for the three month period from July to Sept. 30, 2008 1,304,001 shares traded for a value of $8,329,381.03.
AVERAGE DAILY VOLUME AND VALUE
13,672 shares traded on the average trading day during the nine month period ended September 30, 2009. May saw the highest average traded volume of any of the months is this period with 39,015 shares trading during the average trading day for an average traded value of $213,821.55. During the average trading day for the nine month period, the average value traded was $75,595.
Month Trading days in Month Avg. volume/trading day Avg. value/trading day
January, 2009 21 trades 13,390 shares $67,447.05
February, 2009 20 trades 5,309 shares $34,372.94
March, 2009 22 trades 10,498 shares $56,864.44
April, 2009 20 trades 6,314 shares $34,562.62
May, 2009 21 trades 37,157 shares $203,639.57
June, 2009 20 trades 6,536 shares $19,866.42
July, 2009 22 trades 7,479 shares $53,152.28
August, 2009 20 trades 13,574 shares $58,335.56
September, 2009 22 trades 22,786 shares $152,117.41
Average for the Nine Months 13,672 $75,595.37
SHARE VOLUME AND VALUE LEADERS
The top five share volume leaders on BISX for the nine month period ending September 30, 2009 with their contribution to total traded volume displayed in brackets were:
SYMBOL TRADE VOLUME % OF VOLUME
CBL 530,590 (20.5%)
AML 459,420 (17.7%)
FCL 293,026 (11.3%)
DHS 199.380 (7.7%)
CIB 178,129 (6.9%)
The top five share value leaders for the nine month period ending September 30, 2009 with their contribution to total traded value displayed in brackets were:
SYMBOL TRADE VALUE % OF TRADE VALUE
CBL $3,309,012.42 (23.0%)
CAB $1,888,035.65 (13.1%)
CIB $1,837,421.10 (12.8%)
FCL $1,469,230.20 (10.2%)
FIN $1,356,965.11 (9.4%)
For Additional Information Contact
Holland Grant
BISX Listing Manager
Tel: 242-323-2330
Fax: 242-323-2320
Email: info@bisxbahamas.com
Bahamas International Securities Exchange
50 Exchange Place, Bay Street
P. O. Box EE-15672, Nassau, Bahamas
Website: www.bisxbahamas.com