Bahamas Property Fund Limited Q3 Financial Statements 2017
Bahamas Property Fund Limited have released their Q3 Financial Statements for 2017. The Financial Statements can be viewed in the News Section of Bahamas Property Fund Limited under Quarterly Reports on the website.
AML Foods Limited Q2 Chairman’s Report 2017
AML Foods Limited have released their Q2 Chairman’s Report for 2017. The Chairman’s Report can be viewed in the News Section of AML Foods Limited under Corporate Filings on the website.
FOCOL Holdings Limited Annual Financial Statements and Chairman’s Report 2017
FOCOL Holdings Limited has released their Annual Financial Statements and Chairman’s Report for 2017. The Annual Financial Statements can be viewed in the News Section of FOCOL Holdings Limited under Annual Reports and the Chairman’s Report can be viewed under Corporate Filings Section on the website.
BISX Q3 Statistical Report 2017
BISX has released their Quarterly Statistical Report for the third quarter. The Statistical Report can be viewed in the BISX News Section on the website.
BISX Q3 Statistical Report 2017
FOR IMMEDIATE PUBLICATION
JANUARY TO SEPTEMBER 2017 STATISTICAL REPORT
BISX is pleased to announce its BISX All-Share Index and trading statistics for the nine-month period ending September 29, 2017 with comparison to the same period of 2016.
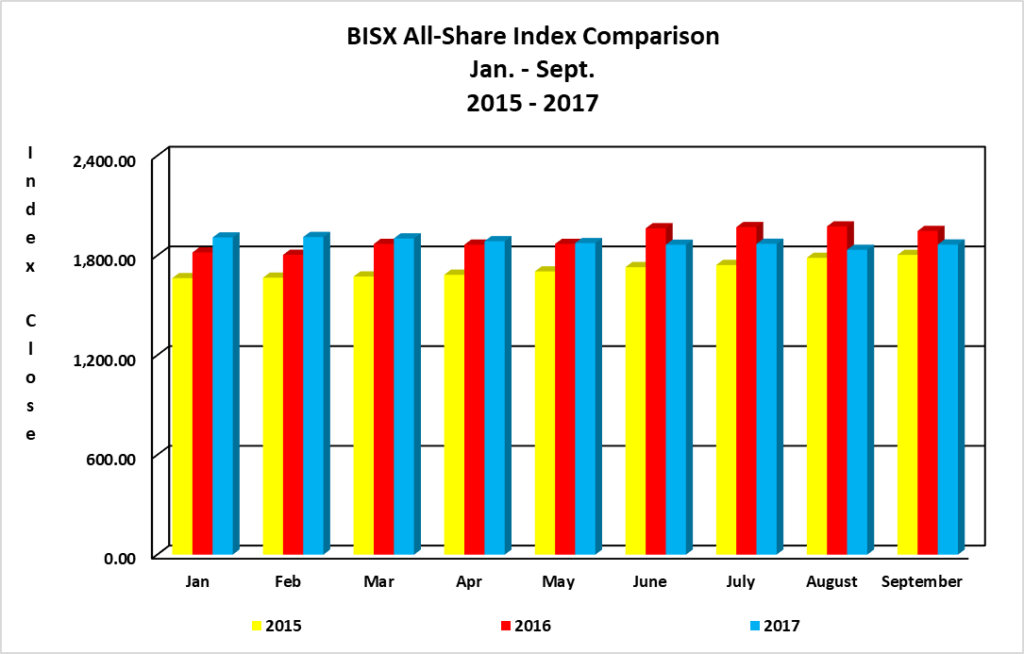
BISX ALL SHARE INDEX
For the nine-month period ending September 29, 2017 the BISX All-Share Index closed at 1,865.88 this represented a year to date decrease of 72.33 or 3.73%. By comparison for the nine-month period ending September 30, 2016 the BISX All-Share Index closed at 1,947.88, this represented a year to date increase of 123.93 or 6.79%. The BISX All-Share Index is a market capitalization weighted index comprised of all primary market listings excluding debt securities.
As at September 29, 2017 the market was comprised of 20 ordinary shares with a market capitalization of $3.944 Billion. In addition, there were 13 preference shares with a market capitalization of $327.25 Million and 19 bonds with a face value of $579 Million.
COMPARISON OF BISX ALL SHARE INDEX TO INTERNATIONAL INDICES
Over the 9-month period January 1 to September 29, 2017, some international equity markets have experienced increases as indicated by the chart below:
| Closing Date | MSCI Emerging Market Index[1] | S&P 500 Index[2] | FTSE 100 Index[3] | BISX All Share Index |
| Dec 30, 2016 |
862.27 |
2,238.83 | 7,142.83 |
1,938.21 |
| Sep 29, 2017 |
1,081.72 |
2,519.36 | 7,372.76 |
1,865.88 |
| % Chg (+/-) |
25.45% |
12.53% | 3.22% |
-3.73% |
TRADING VOLUMES AND VALUES
Trading volume for the nine-month period January 1, 2017 to September 29, 2017 was 3,414,260 securities for a value of $36,445,020.43. By comparison, trading volume for the nine-month period January 1, 2016 to September 30, 2016 was 3,813,602 securities for a value of $25,321,904.16.
Trading volume for the three-month period July 1, 2017 to September 29, 2017 was 1,063,957 securities for a value of $20,708,119.53. By comparison, trading volume for the three-month period July 1, 2016 to September 30, 2016 was 852,915 securities for a value of $9,871,095.51.
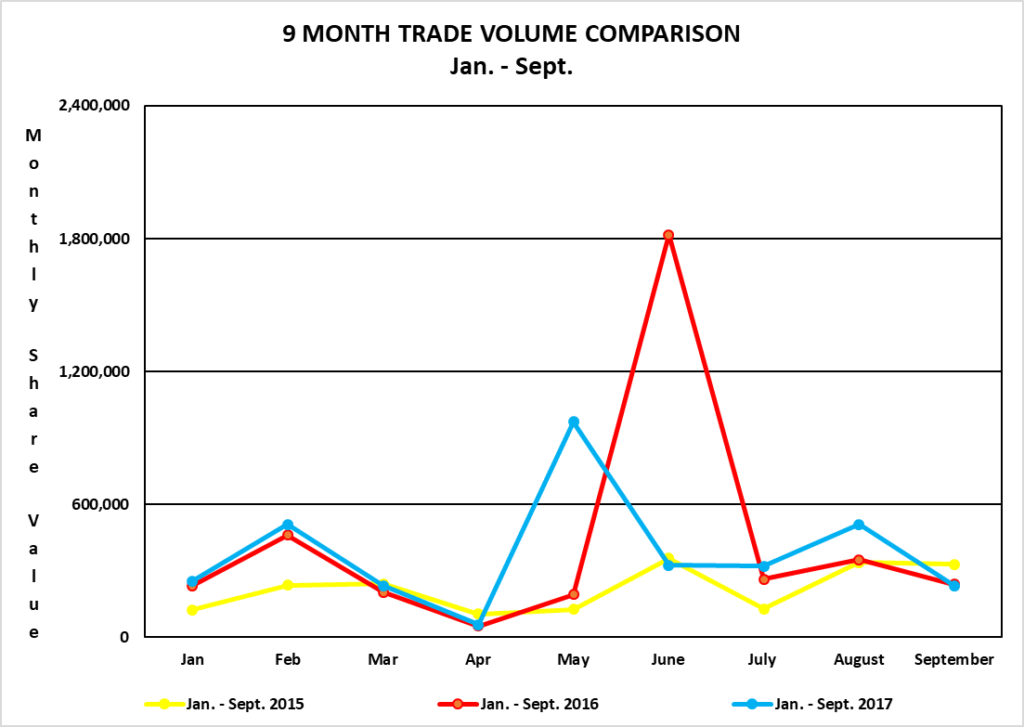
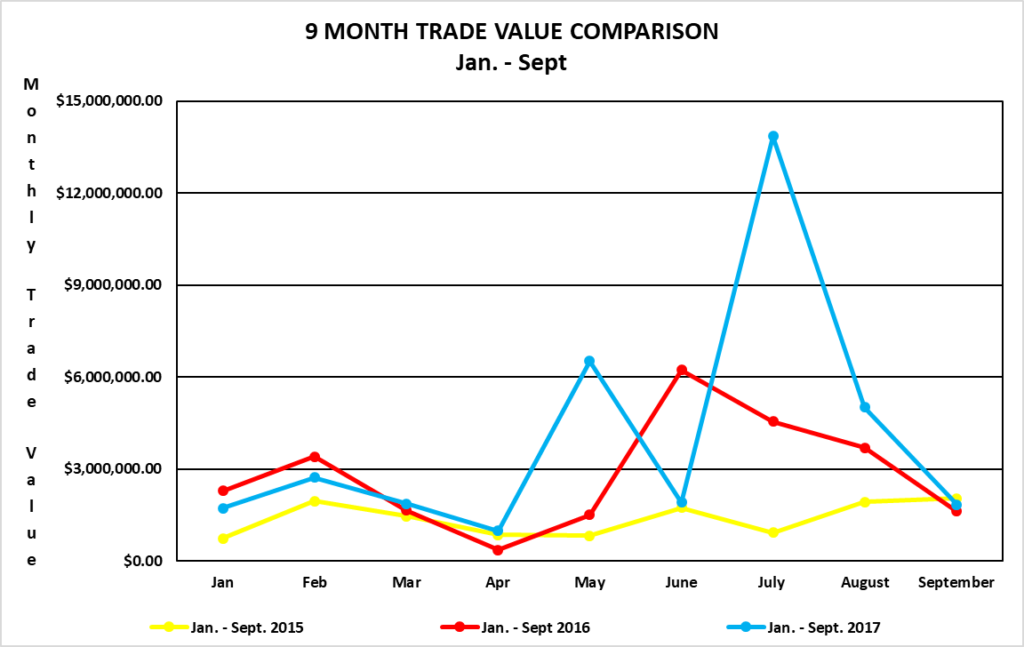
AVERAGE DAILY VOLUME AND VALUE
For the nine-month period from January 1, 2017 to September 29, 2017, the average volume per trading day was 17,811 securities for a value of $193,974.17. By comparison, for the nine-month period from January 1, 2016 to September 30, 2016, the average volume per trading day was 20,240 securities for an average value of $134,582.47.
| Month | Avg. volume / trading day (2017) | Avg. volume / trading day (2016) | Avg. value / trading day (2017) | Avg. value / trading day (2016) |
| January |
12,721 |
11,672 | $86,069.82 |
$114,183.37 |
| February |
25,474 |
21,979 | $135,899.61 |
$162,333.08 |
| March |
10,097 |
9,720 | $81,529.57 |
$78,322.27 |
| April |
3,125 |
2,381 | $54,795.52 |
$17,441.96 |
| May |
42,282 |
9,224 | $283,731.84 |
$72,052.88 |
| June |
16,271 |
86,565 | $95,509.03 |
$296,856.53 |
| July |
16,073 |
12,516 | $692,798.69 |
$216,668.07 |
| August |
23,177 |
16,697 | $228,043.63 |
$176,210.72 |
| September |
11,077 |
11,402 | $87,389.80 |
$77,173.38 |
| Average for period |
17,811 |
20,240 | $193,974.17 |
$134,582.47 |
VOLUME AND VALUE LEADERS (NINE MONTH PERIOD)
The top five volume leaders on BISX for the nine-month period January 1, 2017 to September 29, 2017 with their contribution to total traded volume displayed as a percentage were:
| SYMBOL |
TRADE VOLUME |
% OF VOLUME |
| CHL |
807,589 |
23.9% |
| CBL |
692,113 |
20.5% |
| AML |
632,644 |
18.7% |
| CAB |
398,520 |
11.8% |
| FCL |
290,116 |
8.6% |
The top five value leaders for the nine-month period January 1, 2017 to September 29, 2017 with their contribution to total traded value displayed as a percentage were:
| SYMBOL | TRADE VALUE |
% OF TRADE VALUE |
| CBL | $ 7,132,785.94 |
19.7% |
| BG0407 | $ 7,062,000.00 |
19.5% |
| CHL | $ 4,767,895.72 |
13.2% |
| BG0207 | $ 3,950,000.00 |
10.9% |
| AML | $ 2,757,998.12 |
7.6% |
VOLUME AND VALUE LEADERS (THREE MONTH PERIOD)
The top five volume leaders on BISX for the three-month period July 1, 2017 to September 30, 2017 with their contribution to total traded volume displayed as a percentage were:
| SYMBOL | TRADE VOLUME | % OF VOLUME |
| CBL |
389,860 |
36.6% |
| FCL |
150,321 |
14.1% |
| CAB |
137,387 |
12.9% |
| AML |
107,945 |
10.1% |
| CIB |
77,700 |
7.3% |
The top five value leaders for the three-month period July 1, 2017 to September 30, 2017 with their contribution to total traded value displayed as a percentage were:
| SYMBOL | TRADE VALUE |
% OF TRADE VALUE |
| BG0407 | $ 6,557,000.00 | 31.7% |
| CBL | $ 3,959,175.46 |
19.1% |
| BG0207 | $ 3,950,000.00 |
19.1% |
| FCL | $ 1,265,587.75 | 6.1% |
| BG0105 | $ 1,200,000.00 |
5.8% |