FOR IMMEDIATE PUBLICATION
JANUARY TO JUNE 2020 STATISTICAL REPORT
BISX is pleased to announce its BISX All-Share Index and trading statistics for the six-month period ending June 30, 2020 with comparison to the same period of 2019.
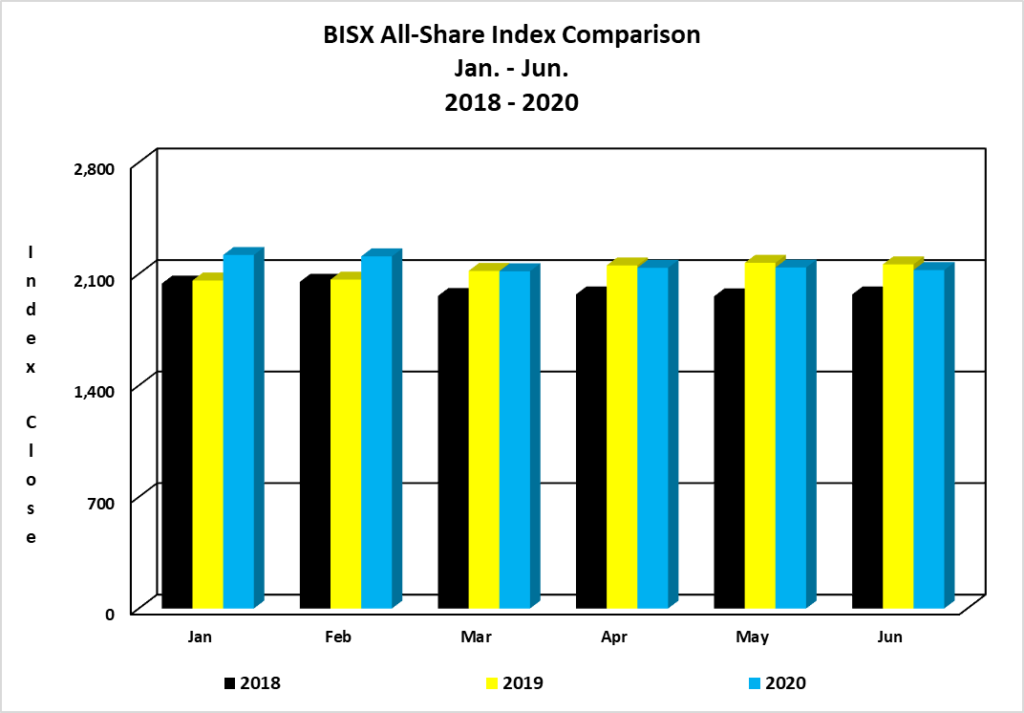
BISX ALL SHARE INDEX
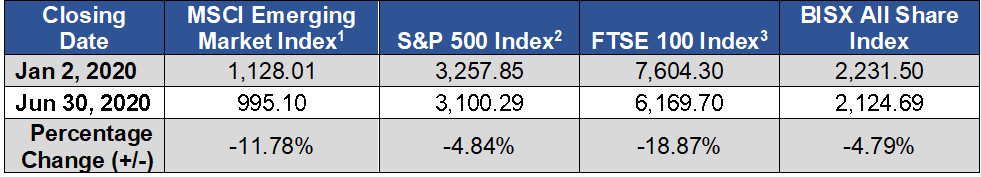
For the six-month period ending June 30, 2020 the BISX All-Share Index closed at 2124.69. This represents a year to date decrease of 106.91 or 4.79%. By comparison for the six-month period ending June 30, 2019 the BISX All-Share Index closed at 2160.46. This represents a year to date increase of 50.51 or 2.42%. The BISX All-Share Index is a market capitalization weighted index comprised of all primary market listings excluding debt securities.
As at June 30, 2020 the market was comprised of 19 ordinary shares with a market capitalization of $4.531 Billion. In addition, there were 7 preference shares with a market capitalization of $243.11 Million and 11 bonds with a face value of $507 Million.
As at December 31, 2019 BISX had 85 mutual funds with total assets under management of approximately $4.9 Billion.
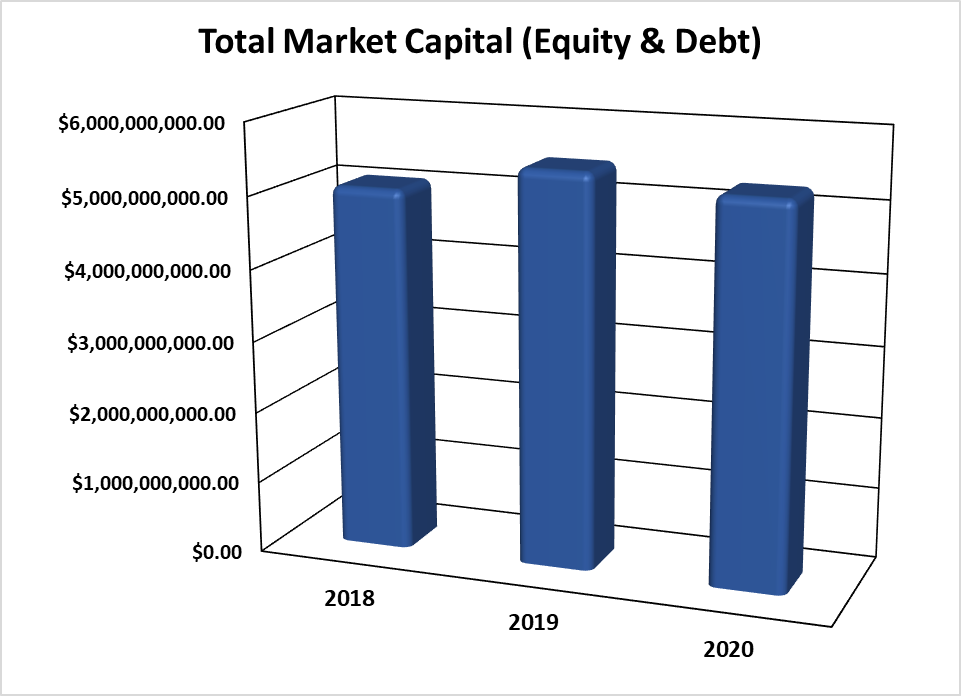
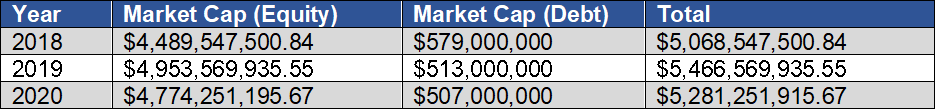
MARKET CAPITAL
Over the 3-year period 2018 to 2020, the market value of all securities listed on BISX has shown an increase from 2018 to 2019 and a decrease from 2019 to 2020, as indicated by the chart below:
COMPARISON OF BISX ALL SHARE INDEX TO INTERNATIONAL INDICES
Over the 6-month period January 2 to June 30, 2020, some international equity markets have experienced decreases as indicated by the chart below:
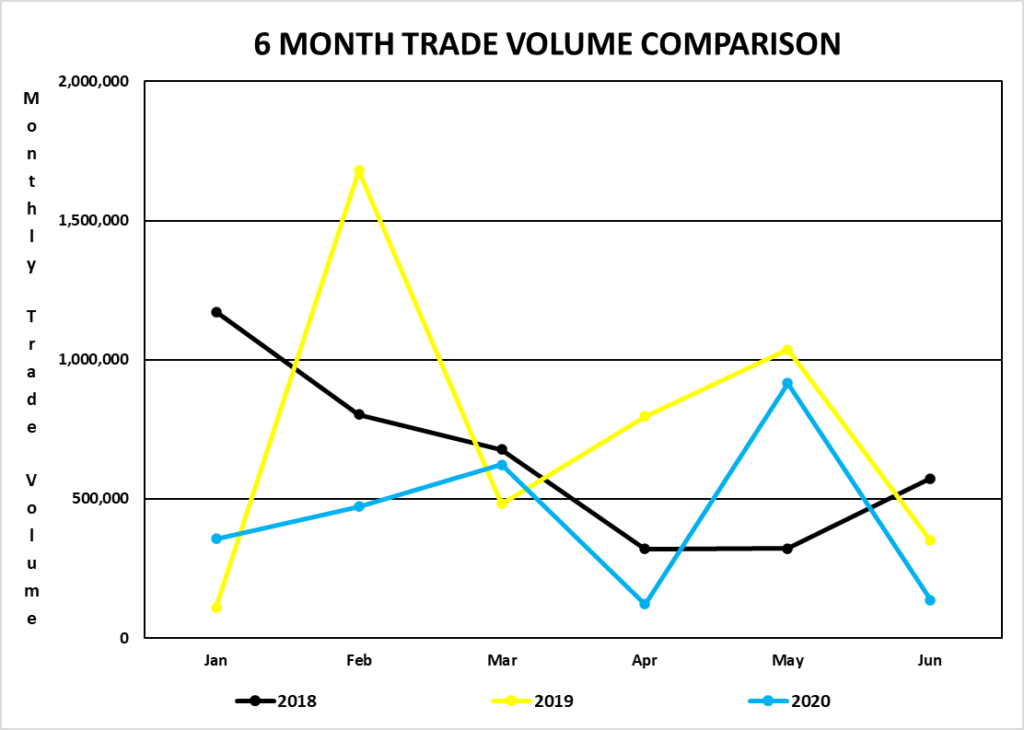
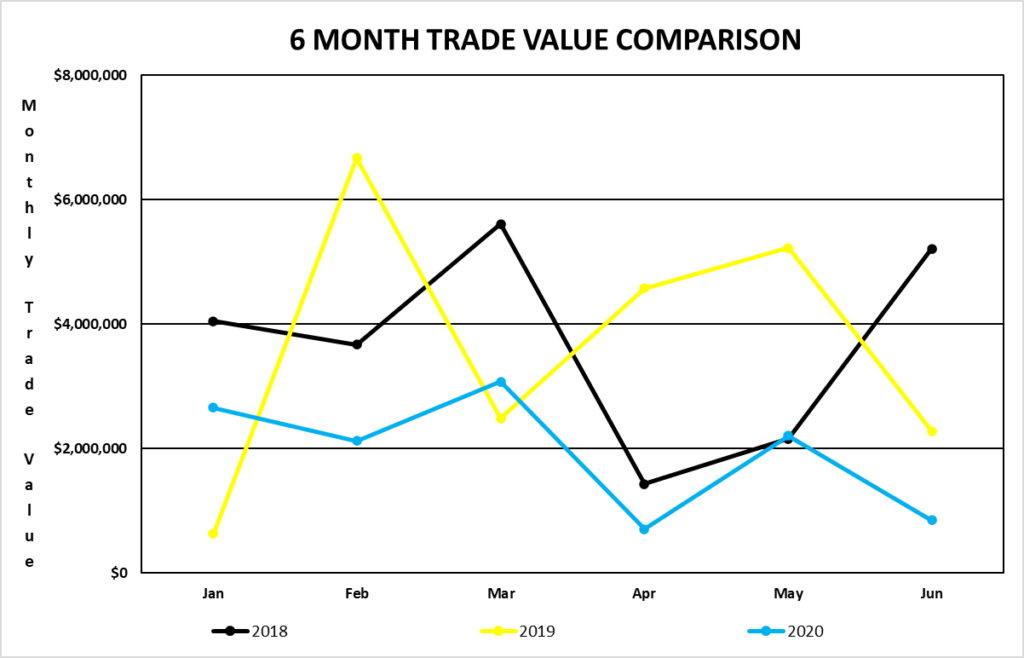
TRADING VOLUMES AND VALUES
Trading volume for the six-month period January 2, 2020 to June 30, 2020 was 2,624,048 shares for a value of $11,622,255.68. Trading volume for the six-month period January 2, 2019 to June 30, 2019 was 4,456,110 shares for a value of $21,868,819.
Trading volume for the three-month period April 1, 2020 to June 30, 2020 was 1,173,646 shares for a value of $3,762,345.12. Trading volume for the three-month period April 1, 2019 to June 30, 2019 was 2,183,140 shares for a value of $12,080,550.63.
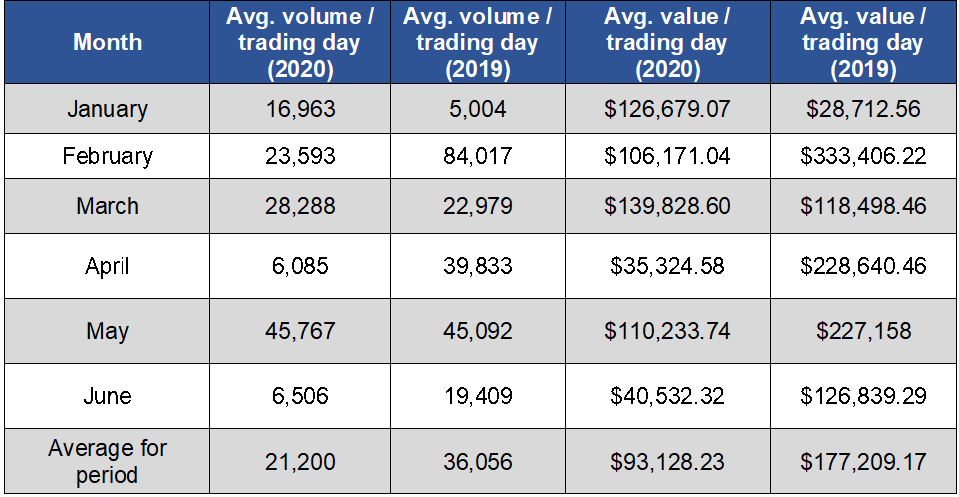
AVERAGE DAILY VOLUME AND VALUE
For the six-month period from January 2, 2020 to June 30, 2020, the average volume per trading day was 21,200 shares for a value of $93,128.23. By comparison, for the six-month period from January 2, 2019 to June 30, 2019, the average volume per trading day was 36,056 shares for a value of $177,209.17.
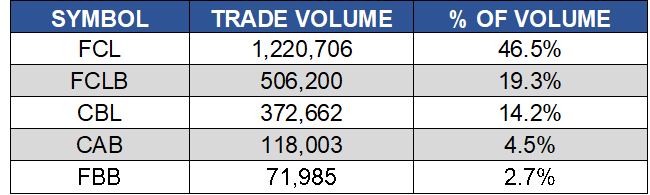
SHARE VOLUME AND VALUE LEADERS (SIX MONTH PERIOD)
The top five share volume leaders on BISX for the six-month period January 2, 2020 to June 30, 2020 with their contribution to total traded volume displayed as a percentage were:
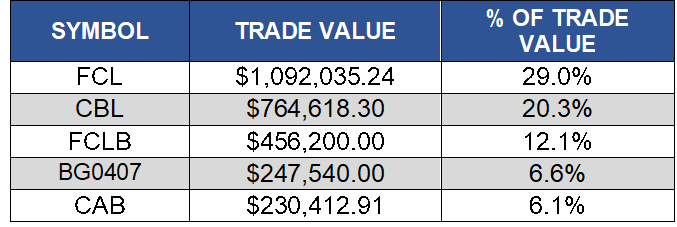
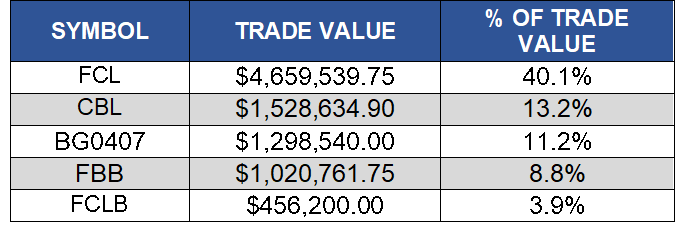
The top five share value leaders on BISX for the six-month period January 2, 2020 to June 30, 2020 with their contribution to total traded value displayed as a percentage were:
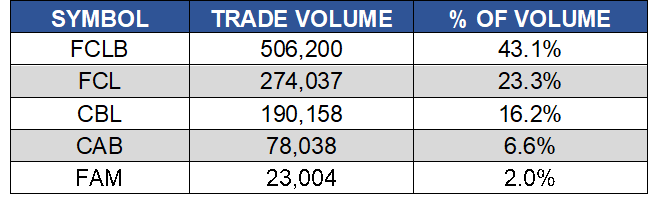
SHARE VOLUME AND VALUE LEADERS (THREE MONTH PERIOD)
The top five share volume leaders on BISX for the three-month period April 1, 2020 to June 30, 2020 with their contribution to total traded volume displayed as a percentage were:
The top five share value leaders on BISX for the three-month period April 1, 2020 to June 30, 2020 with their contribution to total traded value displayed as a percentage were: