BISX PRESS RELEASE
FOR IMMEDIATE PUBLICATION
JANUARY TO DECEMBER 2013 STATISTICAL REPORT
BISX is pleased to announce its BISX All-Share Index and trading statistics for the twelve month period ending December 31, 2013, with comparison to the same period of 2012.
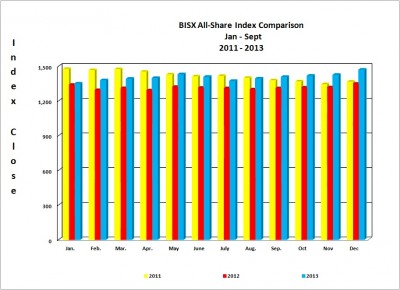
BISX ALL SHARE INDEX
For the twelve month period ending December 31, 2013 the BISX All-Share Index closed at 1, 468.22. This represents a year to date increase of 121.96 or 9.06%. By comparison for the twelve month period ending December 31, 2012 the BISX All-Share Index closed at 1,346.26. This represented a year to date decrease of 18.73 or 1.37%.
For the three month period from October 1, 2013 to December 31, 2013, the All-Share Index increased by 61.97 or 4.41%. By comparison, for the three month period from October 1, 2012 to December 30, 2012, the Index experienced a increase of 37.84 or 2.89%. The BISX All-Share Index is a market capitalization weighted index comprised of all primary market listings excluding debt securities.
As at December 31, 2013 the market was comprised of 27 primary market listings with a market capitalization of $2.998 Billion. The primary market securities traded over BISX include 20 common share listings, 3 preference share listing and 4 tranches of debt. In addition, there are 25 mutual funds listed on the BISX Mutual Fund Listing Facility with approximately $550 Million in assets under management.
COMPARISON OF BISX ALL SHARE INDEX TO INTERNATIONAL INDICES
Over the 12 month period January 1 to December 31, 2013, some international equity markets have experienced increases as indicated by the chart below:
Closing Date * MSCI Emerging Market Index * S&P 500 Index * FTSE 100 Index * BISX All Share Index
Dec 31, 2012 * 1,055.20 * 1,426.19 * 5,897.80 * 1,346.26
Dec 31, 2013 * 1,002.69 * 1,848.36 * 6,749.10 * 1,468.22
Percentage Change (+/-) * -4.98% * 29.60% * 14.43% * 9.06%
TRADING VOLUMES AND VALUES
Trading volume for the twelve month period ending December 31, 2013 was 4,083,628 shares for a value of $17,425,872.19. Trading volume for the twelve month period ending December 31, 2012 was 4,080,393 shares for a value of $18,892.061.93
Trading volume for the three month period October 1, 2013 to December 31, 2013 was 1,449,852.00 for a value of $5,711,682.61. By comparison, for the three month period from October 1, 2012 to December 31, 2012 679,075 shares traded for a value of $3,732,476.83
AVERAGE DAILY VOLUME AND VALUE
For the twelve month period ending December 31, 2013 the average daily trading volume was 16,281 shares which resulted in an average daily trading value of $69,382.12. By comparison for the twelve month period December 31, 2012 the average daily trading volume was 16,146 shares for an average value of $74,433.
During the three month period from October 1, 2013 to December 31, 2013, the average volume per trading day was 23,156 shares for a value of $90,828.80. By comparison, for the three month period from October 1, 2012 to December 31, 2012, the average volume per trading day was 10,687 shares for an average value of $58,741.33
Month * Avg. volume (2013) * Avg. volume (2012) * Avg. value (2013) * Avg. value (2012)
January * 10,384 * 10,678 * $59,195.24 * $27,797
February * 13,957 * 16,307 * $82,753.83 * $70,231
March * 6,383 * 26,464 * $40,153.37 * $146,779
April * 23,815 * 10,751 * $81,113.50 * $51,410
May * 14,093 * 41,072 * $72,000.46 * $149,795
June * 10,961 * 29,094 * $48,993.81 * $133,515
July * 7,550 * 8,382 * $41,808.46 * $48,495
August * 32,350 * 9,324 * $105,735.45 * $41,692
September * 6,412 * 9,613 * $28,344.95 * $52,253
October * 18,274 * 8,770 * $91,542.76 * $48,160
November * 23,981 * 10,744 * $78,868.98 * $53,663
December * 27,212 * 12,548 * $102,074.67 * $74,401
Average for period * 16,281 * 16,146 * $69,382.12 * $74,433
SHARE VOLUME AND VALUE LEADERS (TWELVE MONTH PERIOD)
The top five share volume leaders on BISX for the twelve month period ending December 31, 2013 with their contribution to total traded volume displayed as a percentage were:
SYMBOL * TRADE VOLUME * % OF VOLUME
FBB * 1,072,771 * 26.3%
CBL * 859,230 * 21.0%
CHLA * 493,700 * 12.1%
CHL * 278,580 * 6.8%
AML * 260,618 * 6.4%
The top five share value leaders for the twelve month period ending December 31, 2013 with their contribution to total traded value displayed as a percentage were:
SYMBOL * TRADE VALUE * % OF TRADE VALUE
CBL * $5,494,815.47 * 31.5%
FBB * $2,919,055.36 * 16.8%
CAB * $1,089,769.06 * 6.3%
FCL * $933,512.15 * 5.4%
BOB * $870,361.31 * 5.0%
SHARE VOLUME AND VALUE LEADERS (THREE MONTH PERIOD)
The top five share volume leaders on BISX for the three month period October 1 2013 to December 31, 2013 with their contribution to total traded volume displayed as a percentage were:
SYMBOL * TRADE VOLUME * % OF VOLUME
FBB * 366,618.00 * 25.3%
CBL * 328,854.00 * 22.7%
CHLA * 320,000.00 * 22.1%
AML * 85,059.00 * 5.9%
CIB * 65,920.00 * 4.5%
The top five share value leaders for the three month period October 1, 2013 to December 30, 2013 with their contribution to total traded value displayed as a percentage were:
SYMBOL * TRADE VALUE * % OF TRADE VALUE
CBL * $2,063,801.98 * 36.1%
FBB * $1,099,079.00 * 19.2%
CIB * $477,975.00 * 8.4%
CHLA * $320,000.00 * 5.6%
BOB * $319,213.88 * 5.6%
For Additional Information Contact:
Cha-Nea Hepburn
Tel: 242-323-2330
Fax: 242-323-2320
Email: info@bisxbahamas.com