FOR IMMEDIATE PUBLICATION
JANUARY TO DECEMBER 2020 STATISTICAL REPORT
BISX is pleased to announce its BISX All-Share Index and trading statistics for the twelve-month period ending December 31, 2020 with comparison to the same period of 2019.
BISX ALL SHARE INDEX
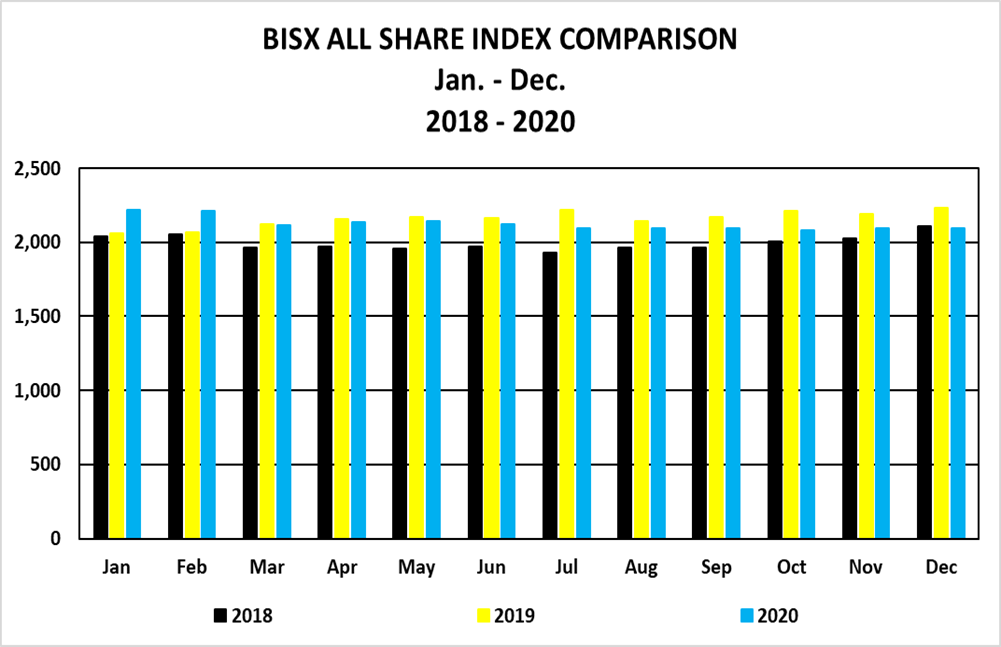
For the twelve-month period ending December 31, 2020 the BISX All-Share Index closed at 2092.46. This represents a year to date decrease of 139.14 or 6.23%. By comparison for the twelve-month period ending December 31, 2019 the BISX All-Share Index closed at 2231.60. That increase was a year to date increase of 122.19 or 5.79%. The BISX All-Share Index is a market capitalization weighted index comprised of all primary market listings excluding debt securities.
As at December 31, 2020 the market was comprised of 20 ordinary shares with a market capitalization of $4.51 Billion. In addition, there were 7 preference shares with a market capitalization of $244 Million, 10 BGS and corporate bonds with a face value of $479 Million, and 210 BRS with a face value of $3.5 billion.
MARKET CAPITAL
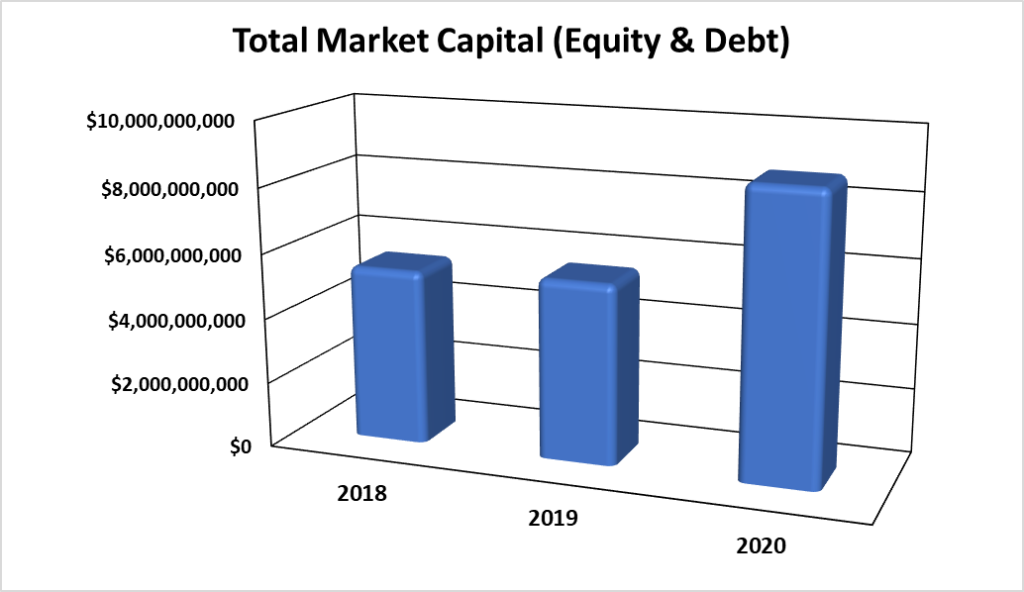
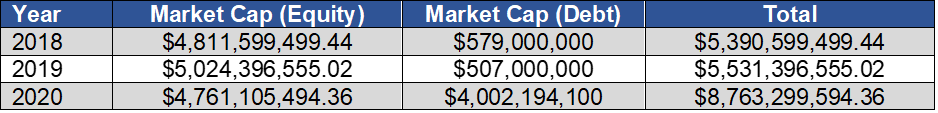
Over the 3-year period 2018 to 2020, the market value of all securities listed on BISX has shown an increase from 2018 to 2019. The increase from 2019 – 2020 was due to the listing of BRS on BISX in July 2020; as indicated by the chart below:
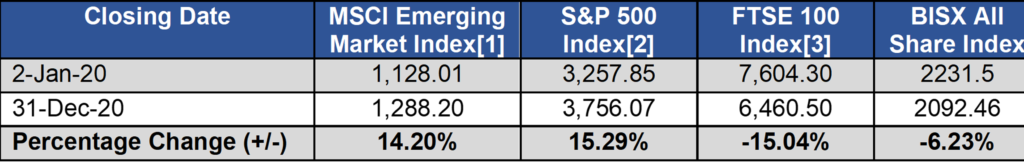
COMPARISON OF BISX ALL SHARE INDEX TO INTERNATIONAL INDICES
Over the 12-month period January 2 to December 31, 2020, some international equity markets have experienced increases and decreases as indicated by the chart below:
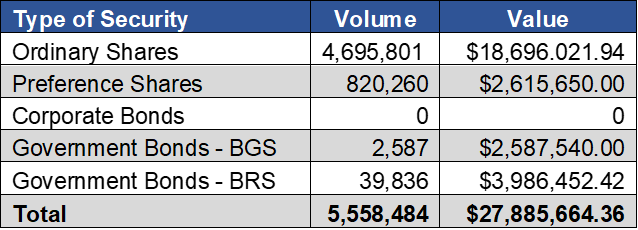
TOTAL TRADES BY SECURITY CLASS
For the twelve-month period ending December 31, 2020, each type of security produced the totals in the chart below.
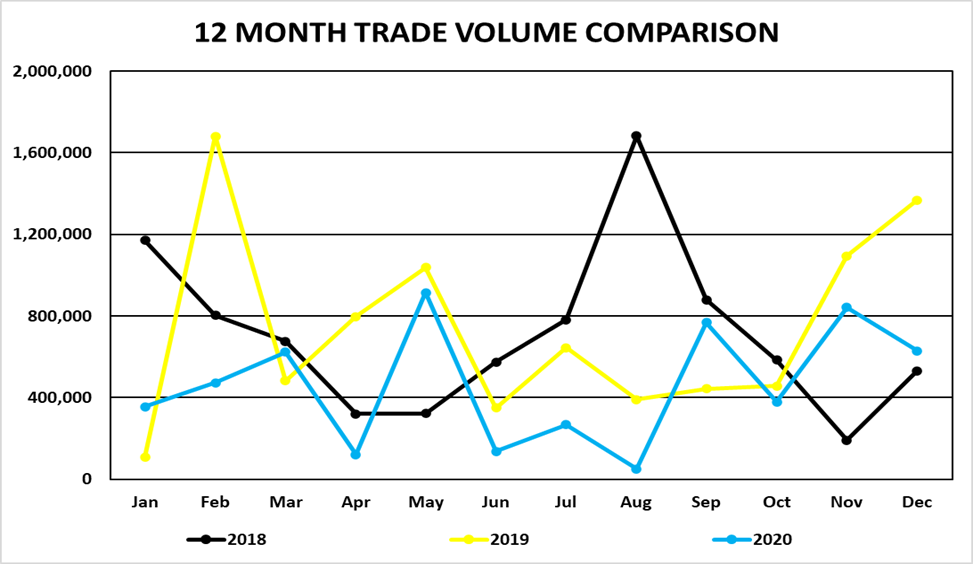
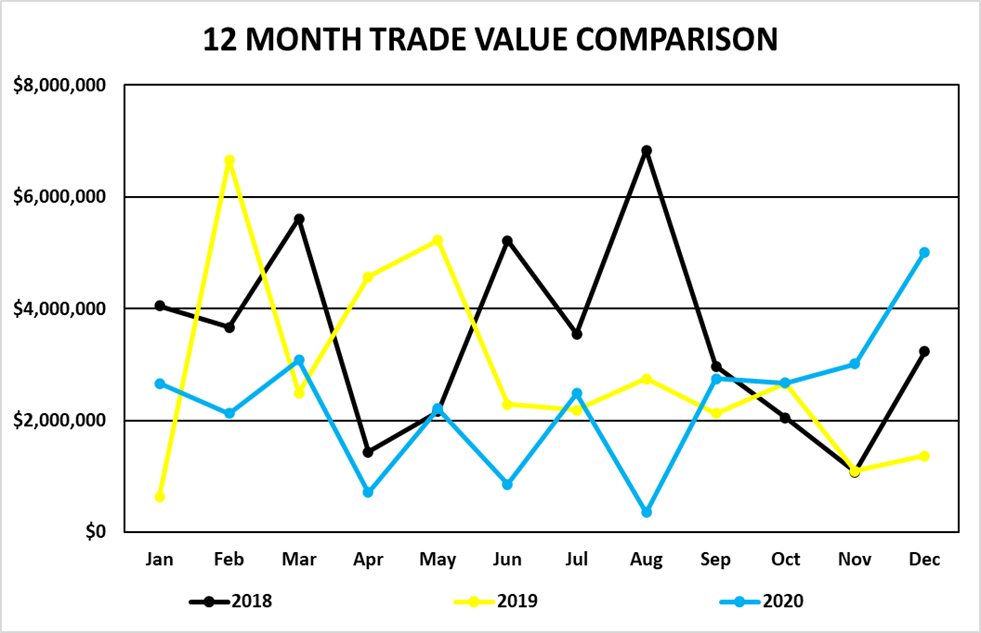
TRADING VOLUMES AND VALUES
Trading volume for the twelve-month period January 2, 2020 to December 31, 2020 was 5,558,484 shares for a value of $27,885,664.36. Trading volume for the twelve-month period January 2, 2019 to December 31, 2019 was 8,853,345 shares for a value of $42,745,590.47.
Trading volume for the three-month period October 1 to December 31, 2020 was 1,850,180 shares for a value of $10,688,918. By comparison, for the three-month period from October 1 to December 31, 2019 was 2,919,089 shares for a value of $13,818,345.31.
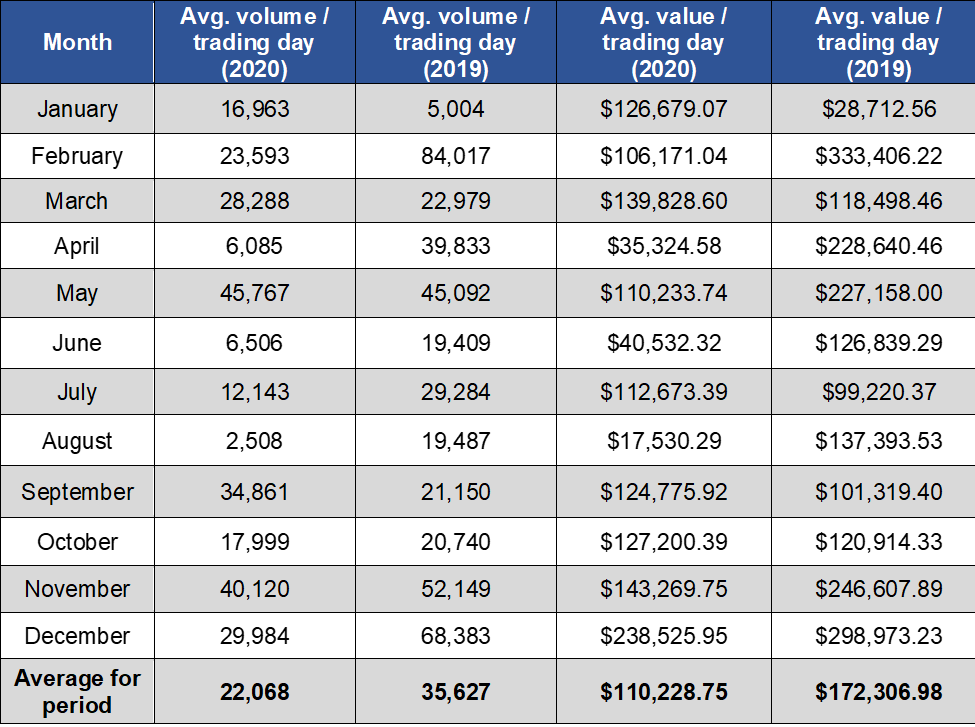
AVERAGE DAILY VOLUME AND VALUE
For the twelve-month period ending December 31, 2020, the average daily trading volume was 22,068 shares which resulted in an average daily trading value of $110,228.75. By comparison for the twelve-month period December 31, 2019 the average daily trading volume was 35,627 shares for an average value of $172,306.98.
During the three-month period from October 1, 2020 to December 31, 2020, the average volume per trading day was 29,368 shares for a value of $169,665.37. By comparison, for the three-month period from October 1, 2019 to December 31, 2019, the average volume per trading day was 47,091 shares for an average value of $222,165.15.
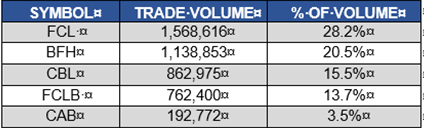
SHARE VOLUME AND VALUE LEADERS (TWELVE MONTH PERIOD)
The top five share volume leaders on BISX for the twelve-month period January 2, 2020 to December 31, 2020 with their contribution to total traded volume displayed as a percentage were:
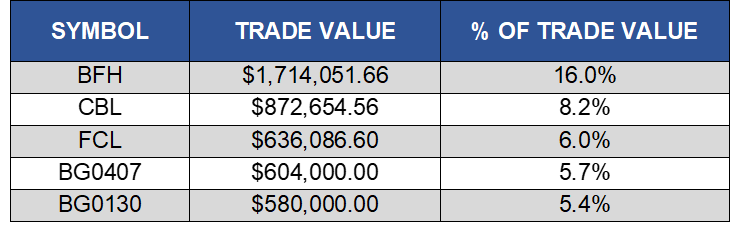
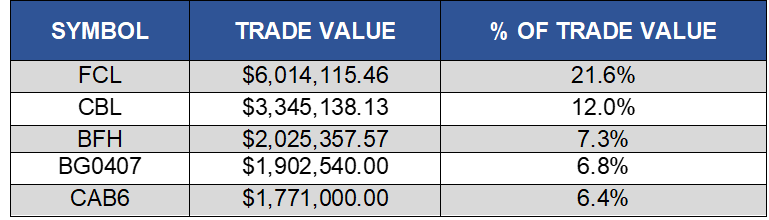
The top five share value leaders for the twelve-month period January 2, 2020 to December 31, 2020 with their contribution to total traded value displayed as a percentage were:
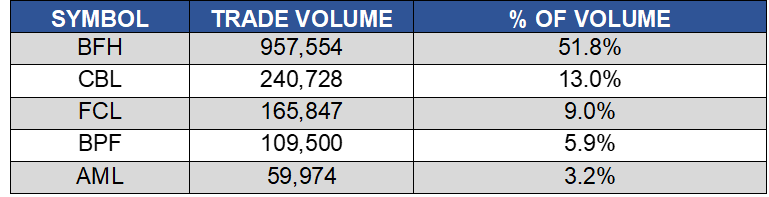
SHARE VOLUME AND VALUE LEADERS (THREE MONTH PERIOD)
The top five share volume leaders on BISX for the three-month period October 1, 2020 to December 31, 2020 with their contribution to total traded volume displayed as a percentage were:
The top five share value leaders for the three-month period October 1, 2019 to December 31, 2019 with their contribution to total traded value displayed as a percentage were: