BISX PRESS RELEASE
FOR IMMEDIATE PUBLICATION
JANUARY TO SEPTEMBER 2011 STATISTICAL REPORT
BISX is pleased to announce its BISX All-Share Index and trading statistics for the nine month period ending September 30, 2011, with comparison to the same period of 2010.
BISX ALL SHARE INDEX
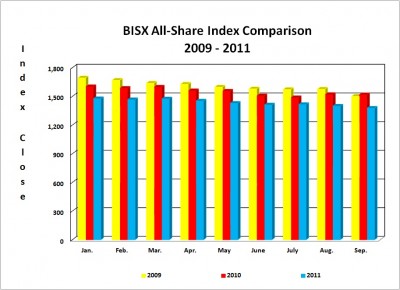
For the nine month period ending September 30, 2011 the BISX All-Share Index closed at 1,376.14. This represents a year to date decrease of 123.37 or -8.23%. By comparison for the nine month period ending September 30, 2010 the BISX All-Share Index closed at 1,516.77. This represented a year to date decrease of 48.61 or -3.11%.
For the three month period from July 1, 2011 to September 30, 2011, the All-Share Index declined by 34.44 or -2.44%. By comparison for the three month period from July 1 to September 30, 2010, the Index experienced an increase of 11.96 or 0.8% from 1,504.81 to 1,516.77. The BISX All-Share Index is a market capitalization weighted index comprised of all primary market listings excluding debt securities.
As at September 30, 2011 the market was comprised of 24 primary market listings with a market capitalization of $2.896 Billion. The primary market securities traded over BISX includes 19 common share listings, 1 preference share listing and 4 tranches of debt. At September 30, 2010 the market was comprised of 23 primary market listings with a market capitalization of $2.938 Billion.
COMPARISON OF BISX ALL SHARE INDEX TO INTERNATIONAL INDICES
Over the 9 month period January 1 to June 30, 2011, some international equity markets have experienced decreases as indicated by the chart below:
Closing Date
MSCI Emerging Market Index
S&P 500 Index
FTSE 100 Index
BISX All Share Index
Dec 31, 2010
1,151.38
1,257.64
5,899.90
1,499.51
Sept. 30, 2011
880.434 1,131.42
5,128.50
1,376.14
Percentage Change (+/-) -23.53% -10.04% -13.07% -8.23%
TRADING VOLUMES AND VALUES
Trading volume for the six month period ending June 30, 2011 was 2,058,857 shares for a value of $9,835,612.34. By comparison, trading volume for the nine month period ending September 30, 2010 was 8,780,142 shares for a value of $96,371,998.43. The trading volume for the nine month period ending September 30, 2010 includes a 5,954,600 share trade in Cable Bahamas Limited (CAB) for a value of approximately $80,000,000 which was carried out in January 2010. Removing this transaction from the 2010 nine month trading statistics results in 2,825,542 shares trading for a value of $16,401,720.43.
For the period, July 1, 2011 to September 30, 2011, 810,822 shares traded for a value of 2,890,317.16. For the three month period from July 1, 2010 to September 30, 2010 700,154 shares traded for a value of $2,962,987.46.
AVERAGE DAILY VOLUME AND VALUE
For the nine month period ending September 30, 2011 the average daily trading volume was 10,861 shares which resulted in an average daily trading value of $52,491. During this nine month period, August 2011 saw the highest average daily trading volume with a daily average of 18,379 shares trading while April saw the highest average daily trading value with $113,986 per day. For the nine month period ending September 30, 2010, excluding the CAB transaction, the average daily trading volume was 15,055 shares which resulted in an average daily trading value of $87,974.76. During this nine month period, April 2010 saw the highest average daily trading volume and value with 48,775 shares and $283,409 trading, respectively. During the three month period from July 1, 2011 to September 30, 2011, the average volume per trading day was 12,387 shares for a value of $44,285. By comparison, for the three month period from April 1, 2010 to June 30, 2010, the average volume per trading day was 11,008 shares for an average value of $46,685.
Month
Avg. volume / trading day (2011)
Avg. volume / trading day (2010)
Avg. value / trading day (2011) Avg. value / trading day (2010)
January 6,505
9,182
$29,299 $82,195
February
8,122
5,365
$47,704 $80,480
March
15,208
18,226
$74,728 $90,706
April
18,379
48,775
$113,986
$283,409
May 4,510
8,763
$21,907 $64,839
June
7,865
12,158
$51,941 $50,089
July
3,346
14,936
$16,246 $81,520
August
18,799
11,430
$56,717 $36,721
September
15,014
6,657
$59,892 $21,813
Average for period
10,861
15,055
$52,491 $87,975
SHARE VOLUME AND VALUE LEADERS (NINE MONTH PERIOD)
The top five share volume leaders on BISX for the nine month period ending September 30, 2011 with their contribution to total traded volume displayed as a percentage were:
SYMBOL
TRADE VOLUME
% OF VOLUME
CBL 530,843 25.8%
AML 346,026 16.8%
CHL 235,740 11.5%
FCLB
192,232 9.3%
BOB 155,958 7.6%
The top five share value leaders for the nine month period ending September 30, 2011 with their contribution to total traded value displayed as a percentage were:
SYMBOL
TRADE VALUE % OF TRADE VALUE
CBL
$ 3,633,510.93
36.9%
BOB
$ 888,458.65
9.0%
CAB
$ 852,597.16
8.7%
FCL
$ 851,303.90
8.7%
FIN
$ 623,868.27
6.3%
SHARE VOLUME AND VALUE LEADERS (THREE MONTH PERIOD)
The top five share volume leaders on BISX for the three month period July 1, 2011 to September 30, 2011 with their contribution to total traded volume displayed as a percentage were:
SYMBOL
TRADE VOLUME
% OF VOLUME
AML
194,012
23.9%
FCLB
173,332
21.4%
CHL
97,298
12.0%
CBL
84,082
10.4%
FCL
69,628
8.6%
The top five share value leaders for the three month period July 1, 2011 to September 30, 2011 with their contribution to total traded value displayed as a percentage were:
SYMBOL
TRADE VALUE % OF TRADE VALUE
CBL
$ 561,821.42
19.4%
FCL
$ 394,211.00
13.6%
CAB
$ 340,887.50
11.8%
FIN
$ 292,030.50
10.1%
CHL
$ 245,277.15
8.5%
For Additional Information Contact:
Holland Grant
BISX Listing Manager
Tel: 242-323-2330
Fax: 242-323-2320
Email: info@bisxbahamas.com