FOR IMMEDIATE PUBLICATION
JANUARY TO JUNE 2018 STATISTICAL REPORT
BISX is pleased to announce its BISX All-Share Index and trading statistics for the six-month period ending June 29, 2018 with comparison to the same period of 2017.
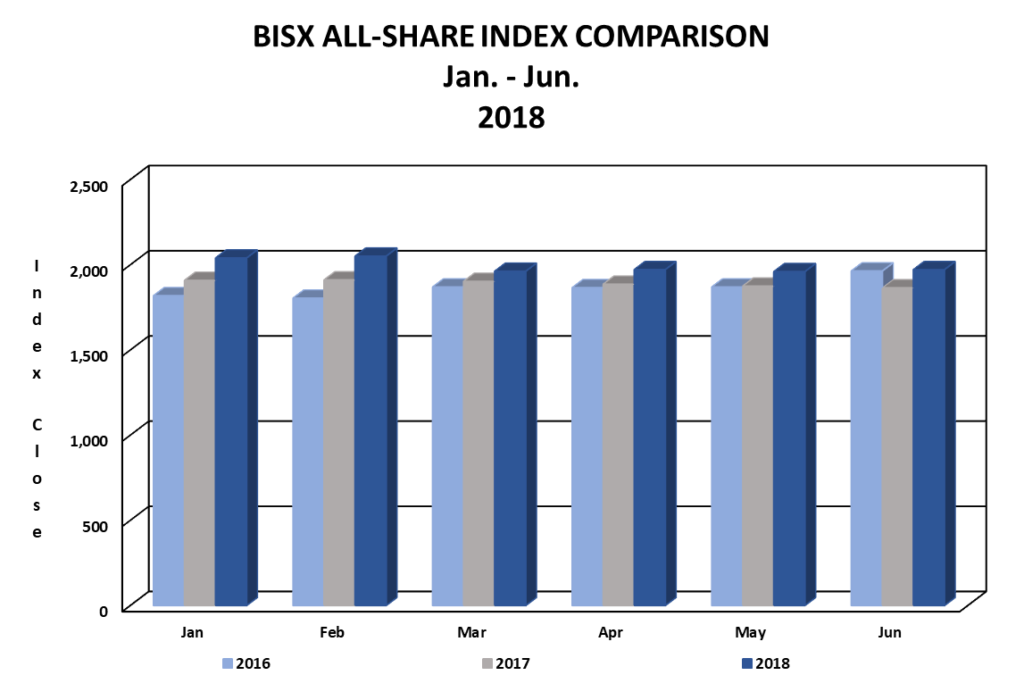
BISX ALL SHARE INDEX
For the six-month period ending June 30, 2018 the BISX All-Share Index closed at 1,971.53. This represents a year to date decrease of 92.04 or -4.46%. By comparison for the six-month period ending June 30, 2017 the BISX All-Share Index closed at 1,864.87. This represented a year to date decrease of 73.34 or 3.78%. The BISX All-Share Index is a market capitalization weighted index comprised of all primary market listings excluding debt securities.
As at June 29, 2018 the market was comprised of 19 ordinary shares with a market capitalization of $4.162 Billion. In addition, there were 13 preference shares with a market capitalization of $327.25 Million and 19 bonds with a face value of $579 Million.
As at 31 December 2017 there were 48 mutual funds listed on BISX with approximately $4.4 Billion in assets under management
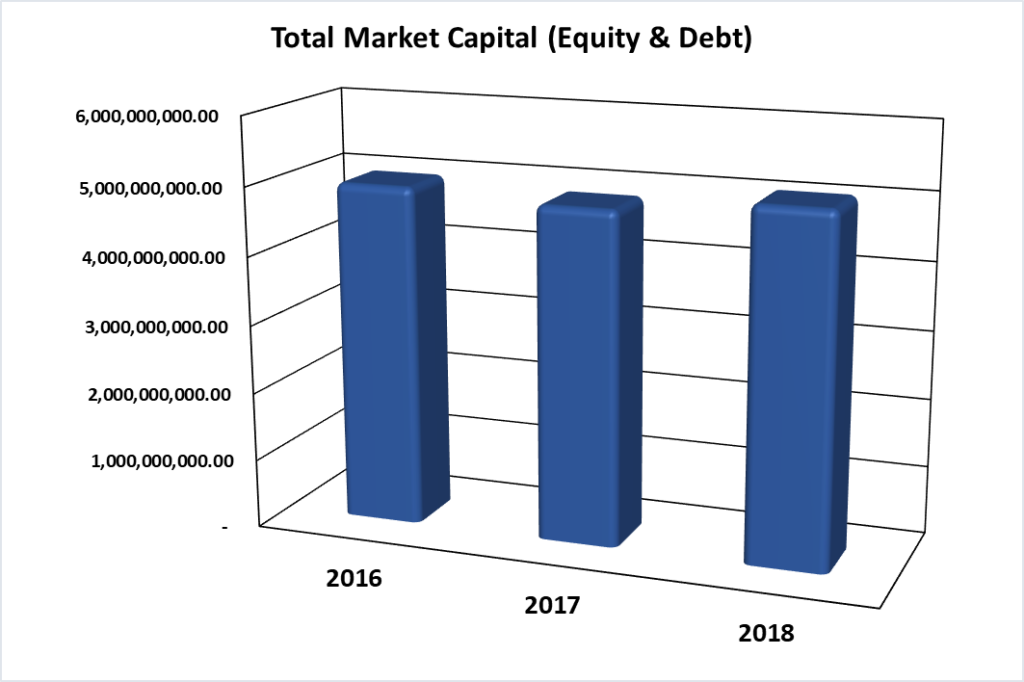
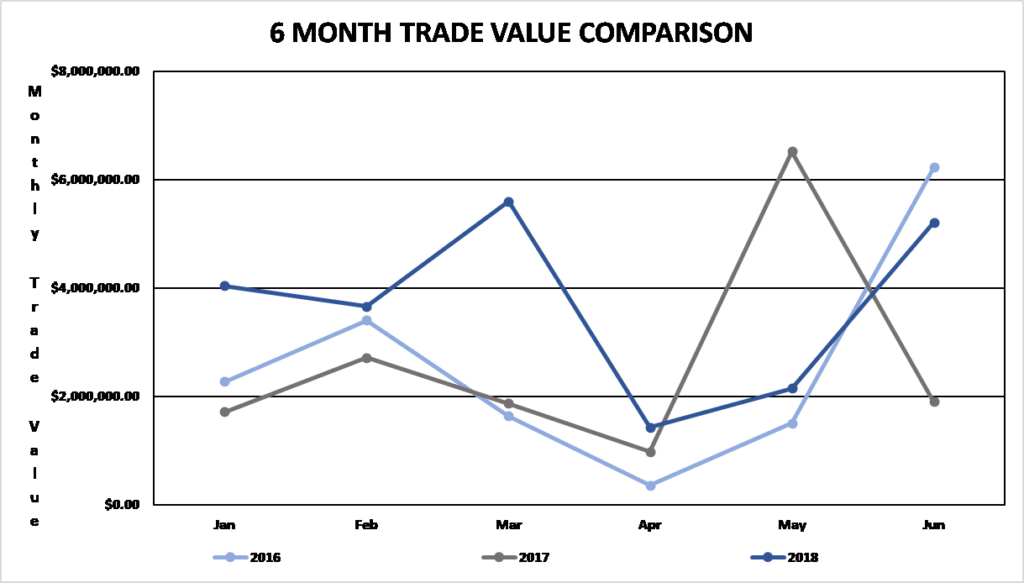
MARKET CAPITAL
Over the 3-year period 2016 to 2018, the market value of all securities listed on BISX has shown a decrease from 2016 – 2017 and an increase from 2017 – 2018, at the beginning of 2018 as indicated by the chart below:
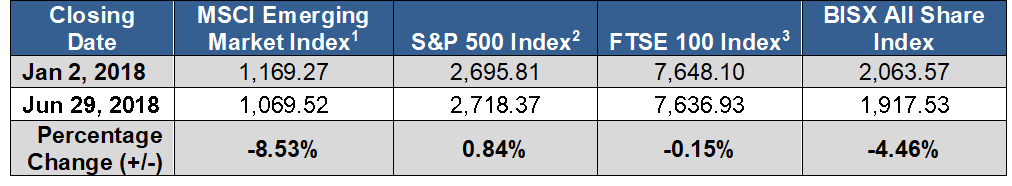
COMPARISON OF BISX ALL SHARE INDEX TO INTERNATIONAL INDICES
Over the 6-month period January 2 to June 29, 2018, many international equity markets have experienced decreases as indicated by the chart below:
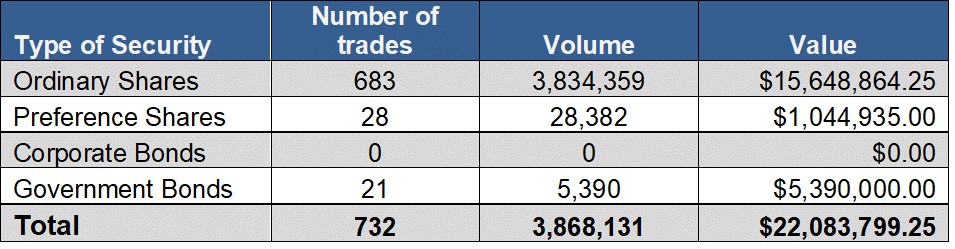
TOTAL TRADES BY SECURITY CLASS
For the six-month period ending June 29, 2018, each type of security produced the totals in the chart below.
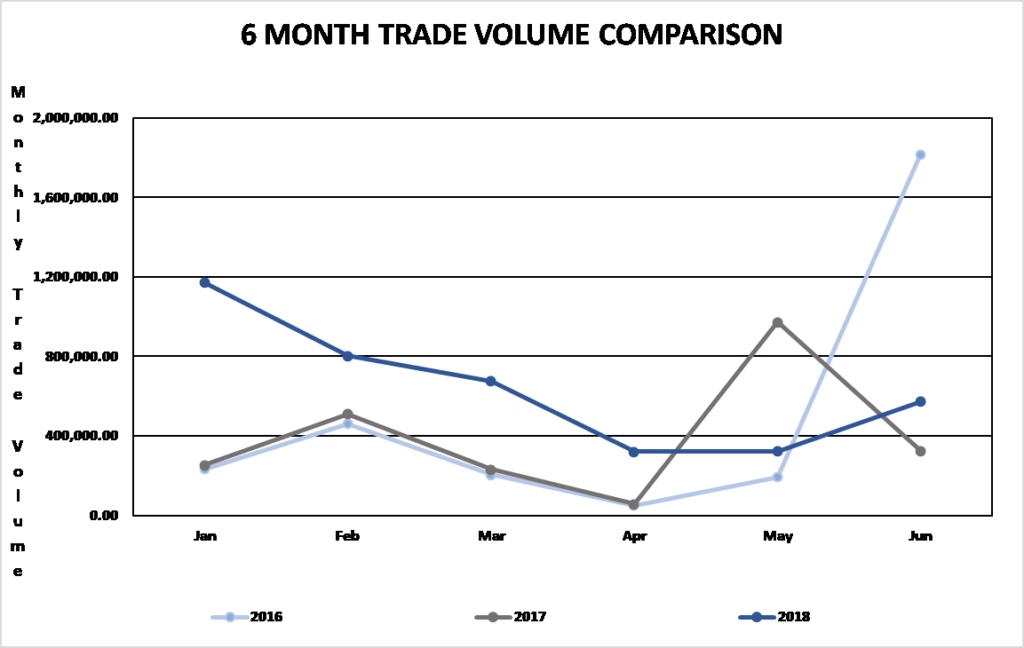
TRADING VOLUMES AND VALUES
Trading volume for the six-month period January 2, 2018 to June 29, 2018 was 3,868,181 shares for a value of $22,133,799.25. Trading volume for the six-month period January 1, 2017 to June 30, 2017 was 2,350,303 shares for a value of $15,736,900.90.
Trading volume for the three-month period April 1, 2018 to June 29, 2018 was 1,217,120 shares for a value of $8,810,107.76. Trading volume for the three-month period April1, 2017 to June 30, 2017 was 1,354,166 shares for a value of $9,422,332.17.
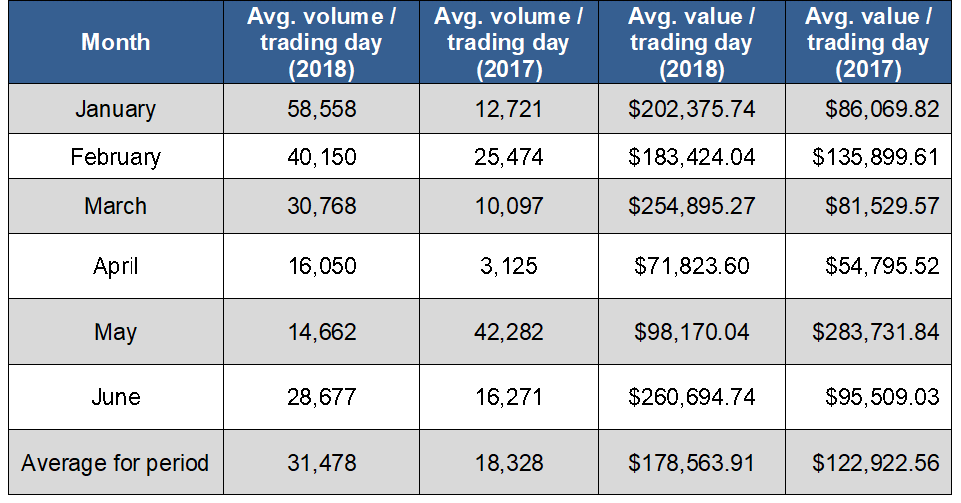
AVERAGE DAILY VOLUME AND VALUE
For the six-month period from January 2, 2018 to June 29, 2018, the average volume per trading day was 31,478 shares for a value of $ 178,563.91. By comparison, for the six-month period from January 1, 2017 to June 30, 2017, the average volume per trading day was 18,328 shares for an average value of $122,922.56.
SHARE VOLUME AND VALUE LEADERS (SIX MONTH PERIOD)
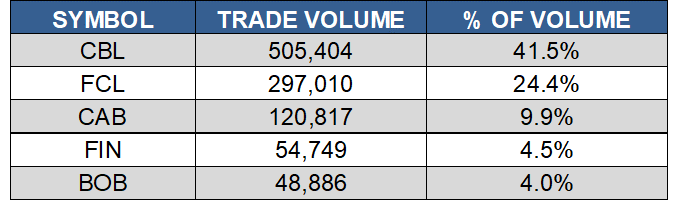
The top five share volume leaders on BISX for the six-month period January 2, 2018 to June 29, 2018 with their contribution to total traded volume displayed as a percentage were:

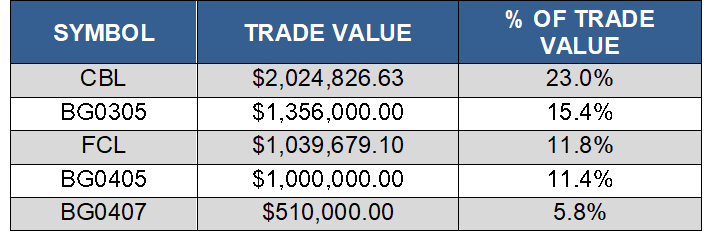
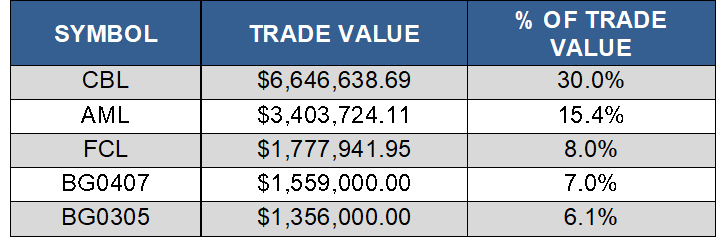
The top five share value leaders on BISX for the six-month period January 2, 2018 to June 29, 2018 with their contribution to total traded value displayed as a percentage were:
SHARE VOLUME AND VALUE LEADERS (THREE MONTH PERIOD)
The top five share volume leaders on BISX for the three-month period April 1, 2018 to June 29, 2018 with their contribution to total traded volume displayed as a percentage were:
The top five share value leaders on BISX for the three-month period April 1, 2018 to June 29, 2018 with their contribution to total traded value displayed as a percentage were: