BISX PRESS RELEASE
FOR IMMEDIATE PUBLICATION
JANUARY TO MARCH 2012 STATISTICAL REPORT
BISX is pleased to announce its BISX All-Share Index and trading statistics for the three month period ending March 31, 2012 with comparison to the same period of 2011.
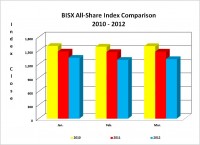
BISX ALL SHARE INDEX
For the three month period ending March 31, 2012 the BISX All-Share Index closed at 1,308.85, this represents a year to date decrease of 56.14 or 4.11%. For the three month period ending March 31, 2011 the BISX All-Share Index closed at 1,473.41. This represented a year to date decrease of 26.10 or 1.74%. The BISX All-Share Index is a market capitalization weighted index comprised of all primary market listings excluding debt securities.
As at March 31, 2012 the market was comprised of 25 primary market listings with a market capitalization of $2.723 Billion. The primary market securities traded over BISX include 19 common share listings, 2 preference share listing and 4 tranches of debt.
COMPARISON OF BISX ALL SHARE INDEX TO INTERNATIONAL INDICES
Over the 3 month period January 1 to March 31, 2012, some international equity markets have experienced increases as indicated by the chart below:
Closing Date MSCI Emerging Market Index S&P 500 Index FTSE 100 Index BISX All Share Index
31-Dec-11 – 916.39 – 1,257.60 – 5,572.30 – 1,364.99
31-Mar-12 – 1,041.450 – 1,408.47 – 5,768.50 – 1,308.85
Percentage Change (+/-) – 13.65% – 12.00% – 3.52% – (4.11%)
TRADING VOLUMES AND VALUES
Trading volume for the three month period ending March 31, 2012 was 1,148,910 shares for a value of $5,287,732.35. By comparison, trading volume for the three month period ending March 31, 2011 was 642,314 shares for a value of $3,258,791.69.
AVERAGE DAILY VOLUME AND VALUE
During the 3 month period ended March 31, 2012, the average volume per trading day was 17,817 shares for an average value of $81,602. March saw the largest average daily trading volume and value during this period with 26,464 shares trading for a value of $146,779. By Comparison, during the 3 month period ended March 31, 2011, the average volume per trading day was 9,945 shares for an average value of $50,577. March saw the largest average daily trading volume and value during the 3 month period ending March 31, 2011, with 15,208 shares trading for $74,728.
Month – Avg. vol./trading day (2012) – Avg. vol./trading day (2011) – Avg. val./ trading day (2012) Avg. val./ trading day (2011)
January – 10,678 – 6,505 – $27,797 – $29,299
February – 16,307 – 8,122 – $70,231 – $47,704
March – 26,464 – 15,208 – $146,779 – $74,728
Average for quarter – 17,817 – 9,945 – $81,602 – $50,577
SHARE VOLUME AND VALUE LEADERS (THREE MONTH PERIOD)
The top five share volume leaders on BISX for the three month period ending March 31, 2012 with their contribution to total traded volume displayed as a percentage were:
SYMBOL – TRADE VOLUME – % OF VOLUME
CBL – 448,448 – 39.0%
FCL – 227,222 – 19.8%
FBB – 188,641 – 16.4%
AML – 110,345 – 9.6%
CAB – 61,653 – 5.4%
The top five share value leaders for the three month period ending March 31, 2012 with their contribution to total traded value displayed as a percentage were:
SYMBOL – TRADE VALUE – % OF TRADE VALUE
CBL – $ 2,770,085.01 – 52.4%
FCL – $ 1,123,213.25 – 21.2%
CAB – $ 464,304.85 – 8.8%
FBB – $ 292,443.55 – 5.5%
FIN- $ 149,111.85 – 2.8%
For Additional Information Contact:
Mrs. Elude Michel-Sturrup
Tel: 242-323-2330
Fax: 242-323-2320
Email: info@bisxbahamas.com