FOCOL Holdings Limited released their Annual Financial Statements for 2019. The Annual Financial Statements can be viewed in the News Section of FOCOL Holdings Limited under Annual Reports on the website.
FOCOL Holdings Limited Year End Chairman’s Report 2019
FOCOL Holdings Limited released their year end Chairman’s Report for 2019. The Chairman’s Report can be viewed in the News Section of FOCOL Holdings Limited under Corporate Filings on the website.
Commonwealth Bank Limited Dividend Notice (December 2019)
Commonwealth Bank Limited declared dividends of $0.02 to shareholder as of record date December 16, 2019, payable on December 31, 2019.
Fidelity Bank (Bahamas) Limited Extraordinary Dividend Notice (December 2019)
Fidelity Bank (Bahamas) Limited declared extraordinary dividends of $0.26 for shareholders as of record date December 11, 2019, payable on December 13, 2019.
Fidelity Bank (Bahamas) Limited Dividend Notice (December 2019)
Fidelity Bank (Bahamas) Limited declared dividends of $0.31 for shareholders as of record date December 11, 2019, payable on December 13, 2019.
BISX Q3 Statistical Report 2019
FOR IMMEDIATE PUBLICATION
JANUARY TO SEPTEMBER 2019 STATISTICAL REPORT
BISX is pleased to announce its BISX All-Share Index and trading statistics for the nine-month period ending September 30, 2019 with comparison to the same period of 2018.
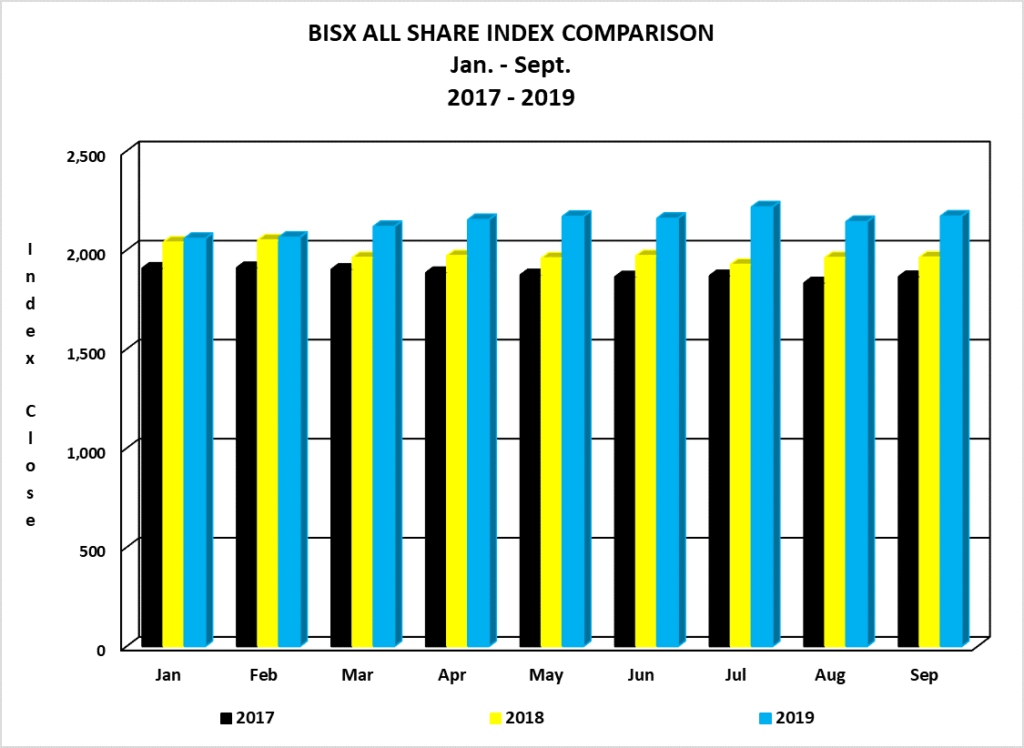
BISX ALL SHARE INDEX
For the nine-month period ending September 30, 2019 the BISX All-Share Index closed at 2,171.36 this represented a year to date increase of 61.95 or 2.94%. By comparison for the nine-month period ending September 28, 2018 the BISX All-Share Index closed at 1,964.04 this represented a year to date decrease of 99.53 or 4.82%. The BISX All-Share Index is a market capitalization weighted index comprised of all primary market listings excluding debt securities.
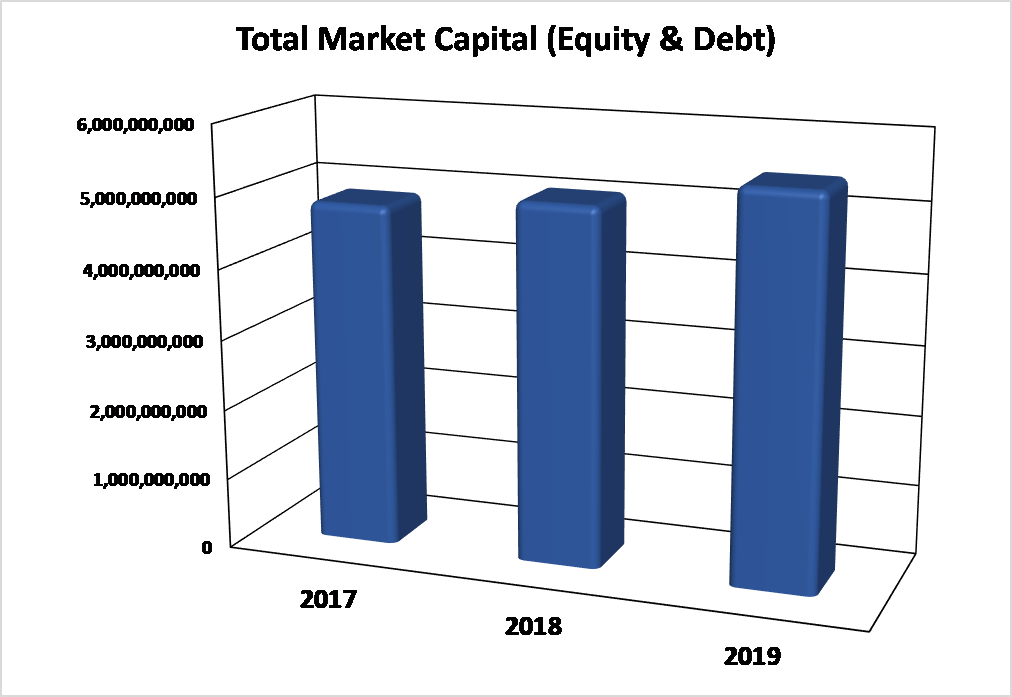
As at September 30, 2019 the market was comprised of 19 ordinary shares with a market capitalization of $4.983 Billion. In addition, there were 8 preference shares with a market capitalization of $277 Million and 13 bonds with a face value of $513 Million.
MARKET CAPITAL
Over the 3-year period 2017 to 2019, the market value of all securities listed on BISX has shown an increase from 2017 – 2019, as indicated by the chart below:
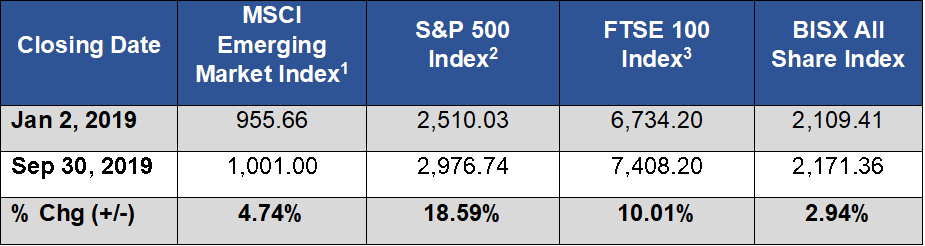
COMPARISON OF BISX ALL SHARE INDEX TO INTERNATIONAL INDICES
Over the 9-month period January 2 to September 30, 2019, some international equity markets have experienced increases as indicated by the chart below:
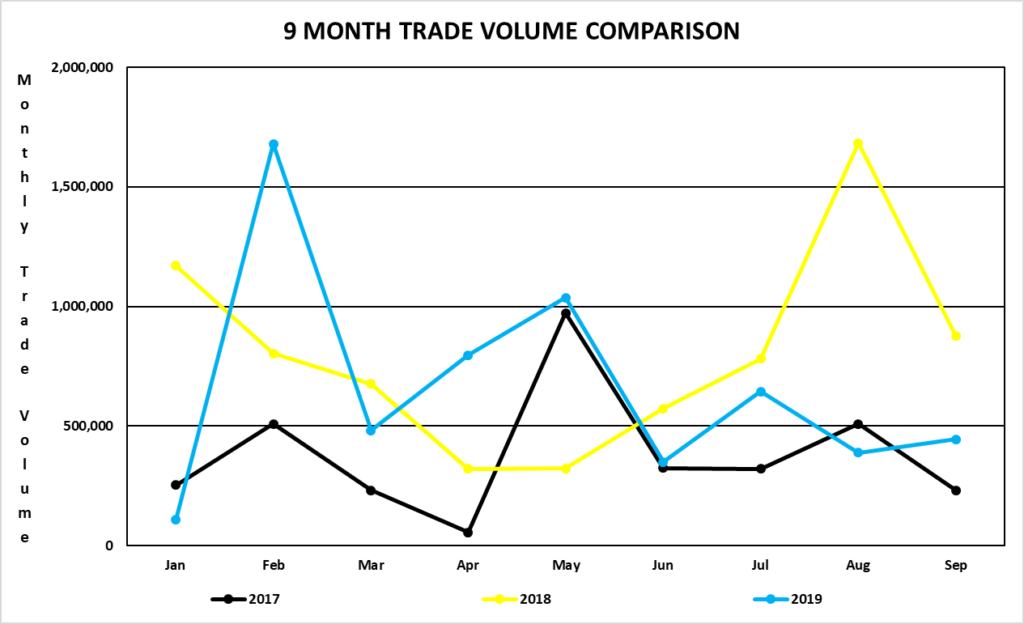
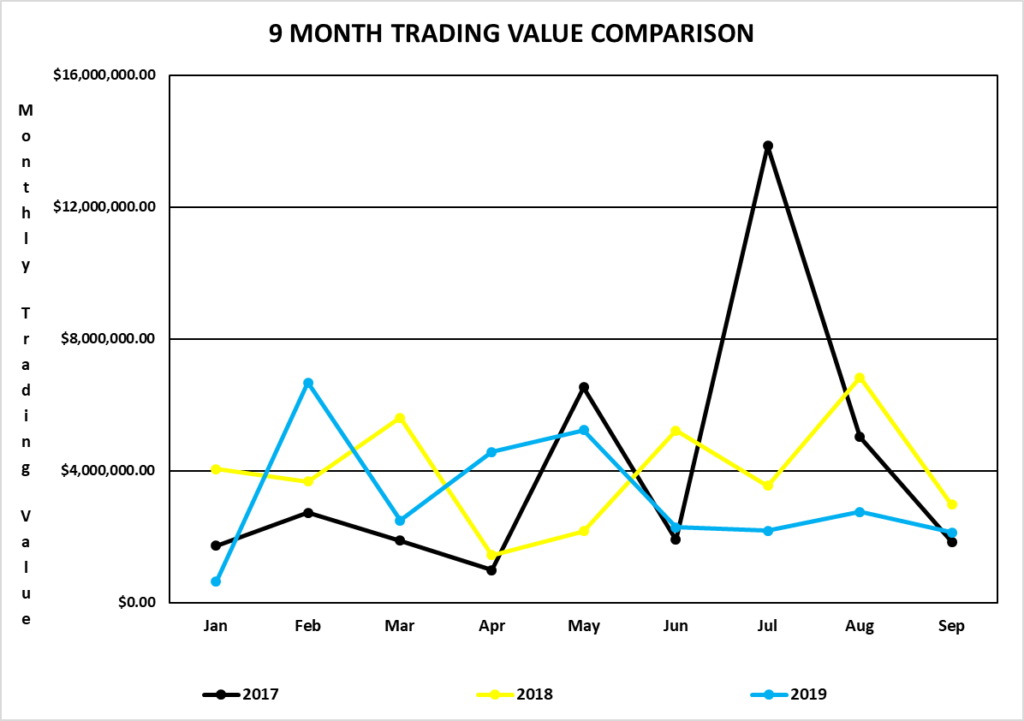
TRADING VOLUMES AND VALUES
Trading volume for the nine-month period January 2, 2019 to September 28, 2019 was 5,934,256
shares for a value of $28,927,245.16. By comparison, trading volume for the nine-month period January 1, 2018 to September 28, 2018 was 7,211,268 shares for a value of $35,480,614.86.
Trading volume for the three-month period July 1, 2019 to September 30, 2019 was 1,478,146 shares for a value of $7,058,425.96. By comparison, trading volume for the three-month period July 1, 2018 to September 28, 2018 was 3,343,087 shares for a value of $13,346,815.61.
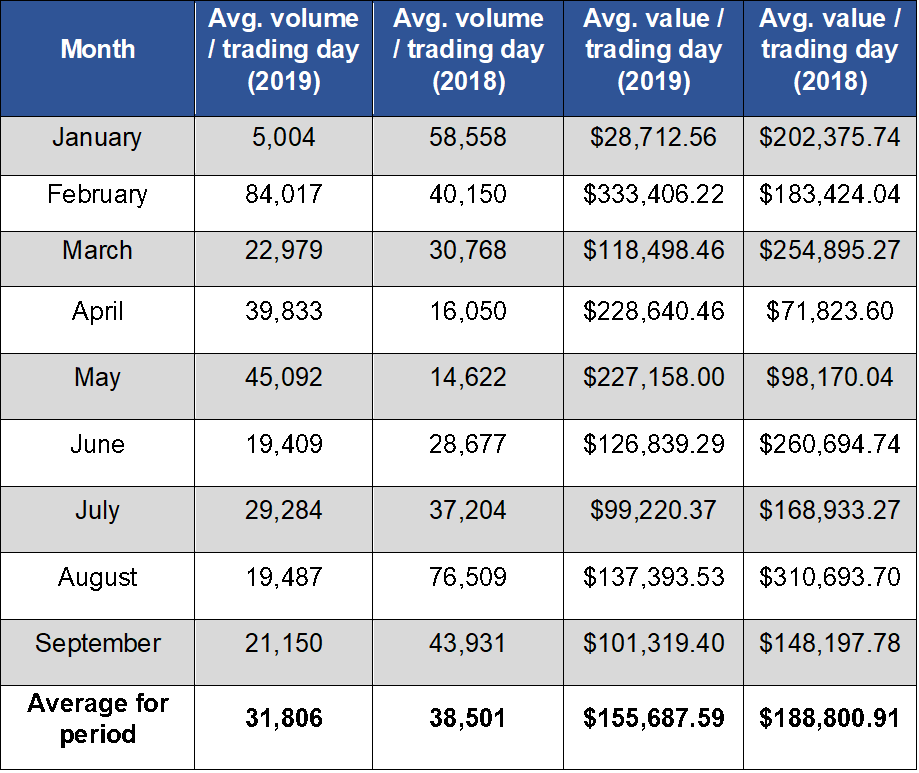
AVERAGE DAILY VOLUME AND VALUE
For the nine-month period from January 2, 2019 to September 30, 2019, the average volume per trading day was 31,806 shares for a value of $155,687.59. By comparison, for the nine-month period from January 2, 2018 to September 28, 2018, the average volume per trading day was 38,501 shares for an average value of $188,800.91.
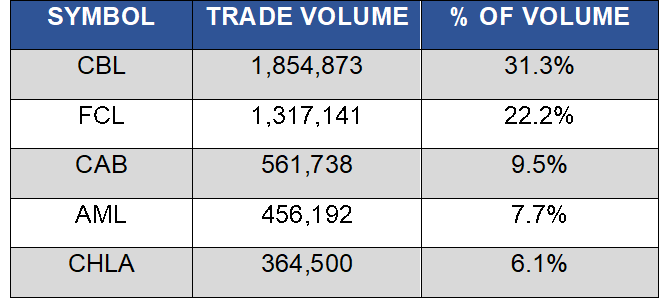
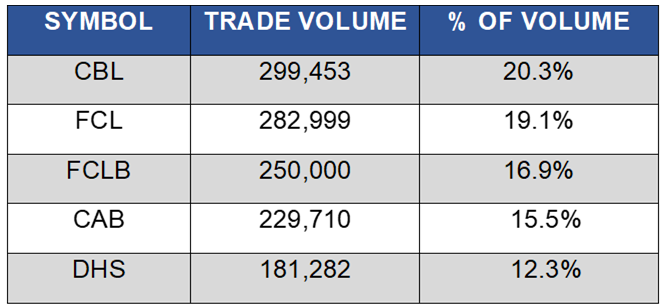
SHARE VOLUME AND VALUE LEADERS (NINE MONTH PERIOD)
The top five share volume leaders on BISX for the nine-month period January 2, 2019 to September 30, 2019 with their contribution to total traded volume displayed as a percentage were:
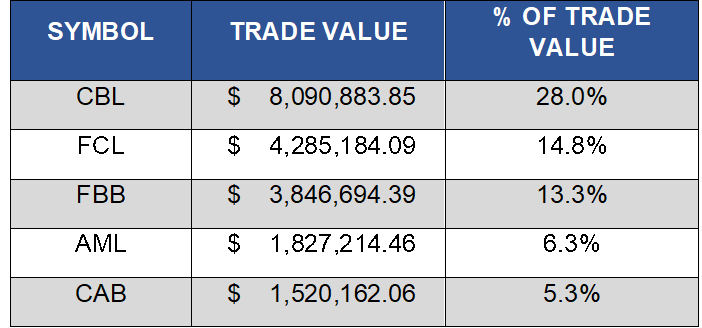
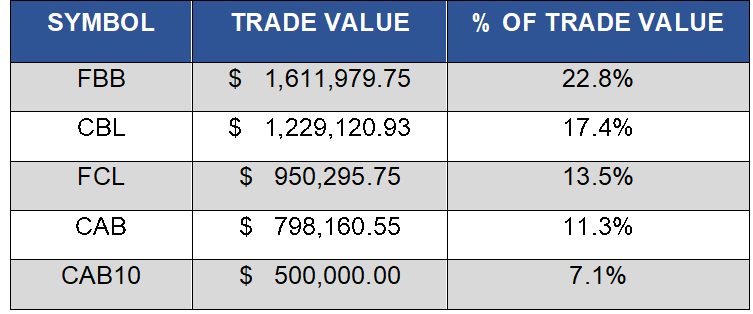
The top five share value leaders for the nine-month period January 2, 2019 to September 30, 2019 with their contribution to total traded value displayed as a percentage were:
SHARE VOLUME AND VALUE LEADERS (THREE MONTH PERIOD)
The top five share volume leaders on BISX for the three-month period July 1, 2019 to September 30, 2019 with their contribution to total traded volume displayed as a percentage were:
The top five share value leaders for the three-month period July 1, 2019 to September 30, 2019 with their contribution to total traded value displayed as a percentage were:
- « Previous Page
- 1
- …
- 89
- 90
- 91
- 92
- 93
- …
- 203
- Next Page »