FOR IMMEDIATE PUBLICATION
JANUARY TO SEPTEMBER 2018 STATISTICAL REPORT
BISX is pleased to announce its BISX All-Share Index and trading statistics for the nine-month period ending September 28, 2018 with comparison to the same period of 2017.
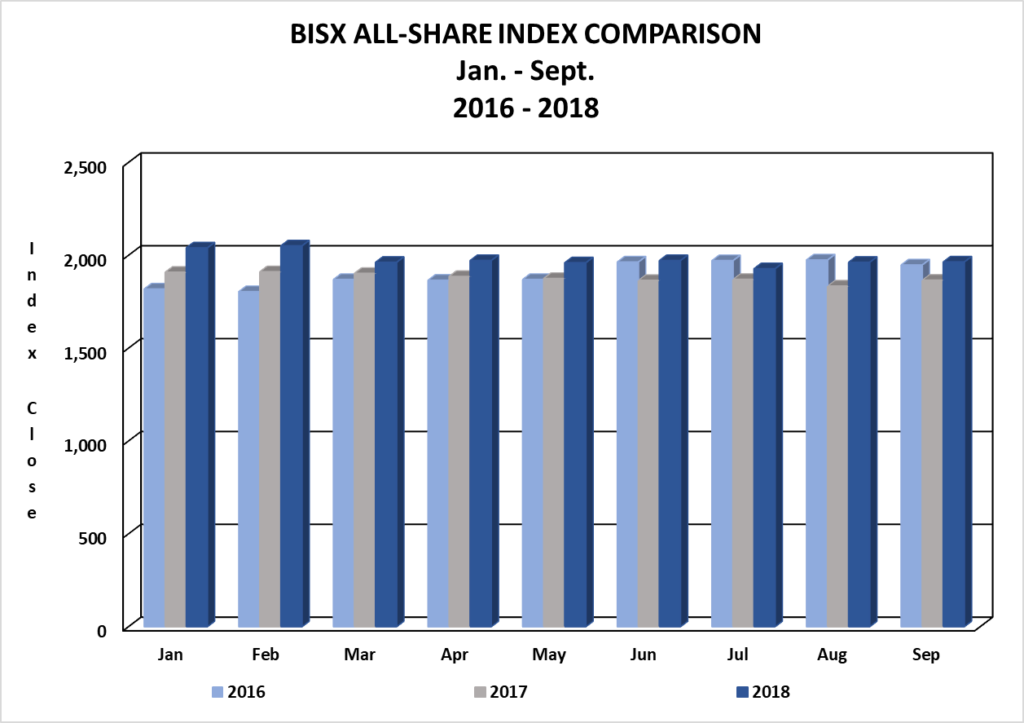
BISX ALL SHARE INDEX
For the nine-month period ending September 28, 2018 the BISX All-Share Index closed at 1,964.04 this represented a year to date decrease of 99.53 or 4.82%. By comparison for the nine-month period ending September 29, 2017 the BISX All-Share Index closed at 1,865.88 this represented a year to date decrease of 72.33 or 3.73%. The BISX All-Share Index is a market capitalization weighted index comprised of all primary market listings excluding debt securities.
As at September 28, 2018 the market was comprised of 19 ordinary shares with a market capitalization of $4.144 Billion. In addition, there were 13 preference shares with a market capitalization of $327 Million and 19 bonds with a face value of $579 Million.
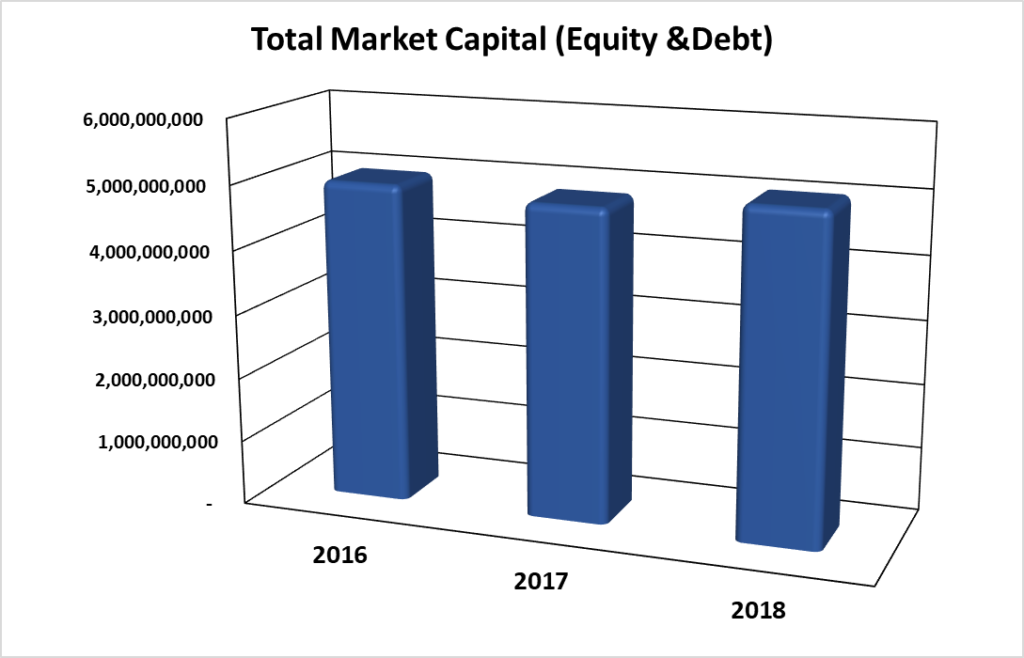
MARKET CAPITAL
Over the 3-year period 2016 to 2018, the market value of all securities listed on BISX has shown a decrease from 2016 – 2017 and an increase from 2017 – 2018, at the beginning of 2018 as indicated by the chart below:
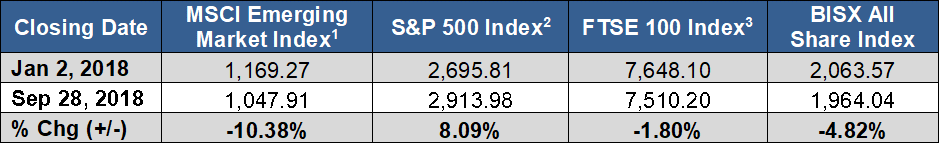
COMPARISON OF BISX ALL SHARE INDEX TO INTERNATIONAL INDICES
Over the 9-month period January 2 to September 28, 2018, international equity markets have experienced mixed performances as indicated by the chart below:
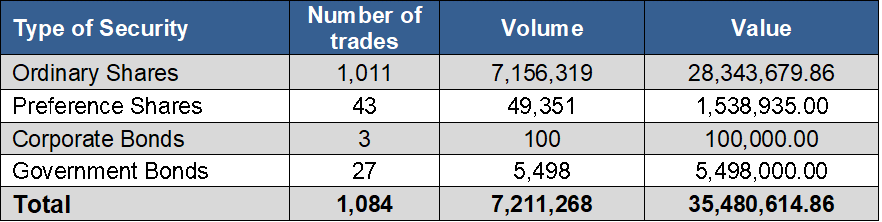
TOTAL TRADES BY SECURITY CLASS
For the nine-month period ending September 28, 2018, each type of security produced the totals in the chart below.
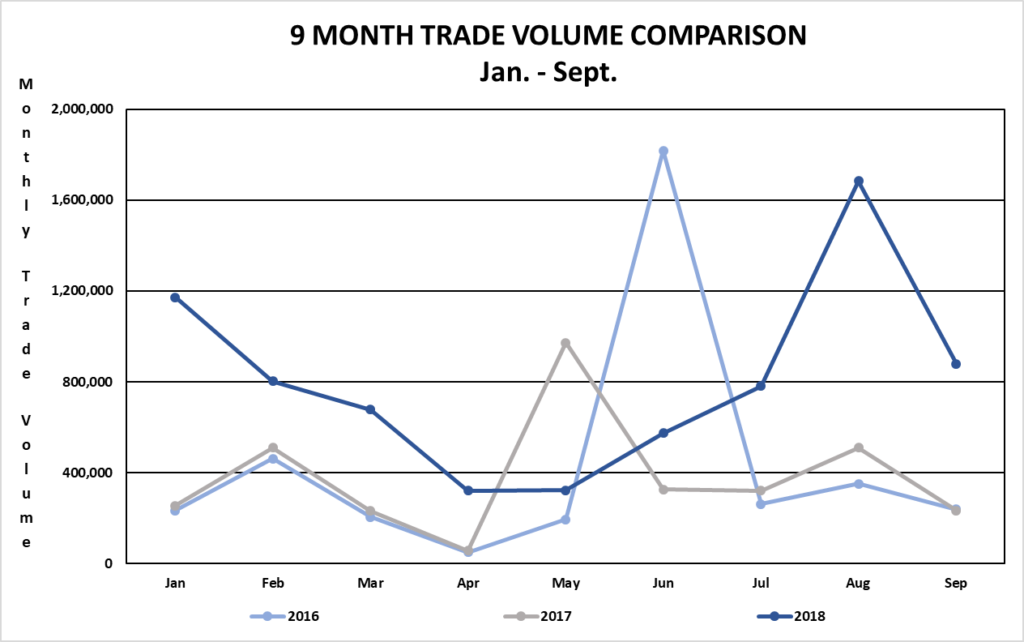
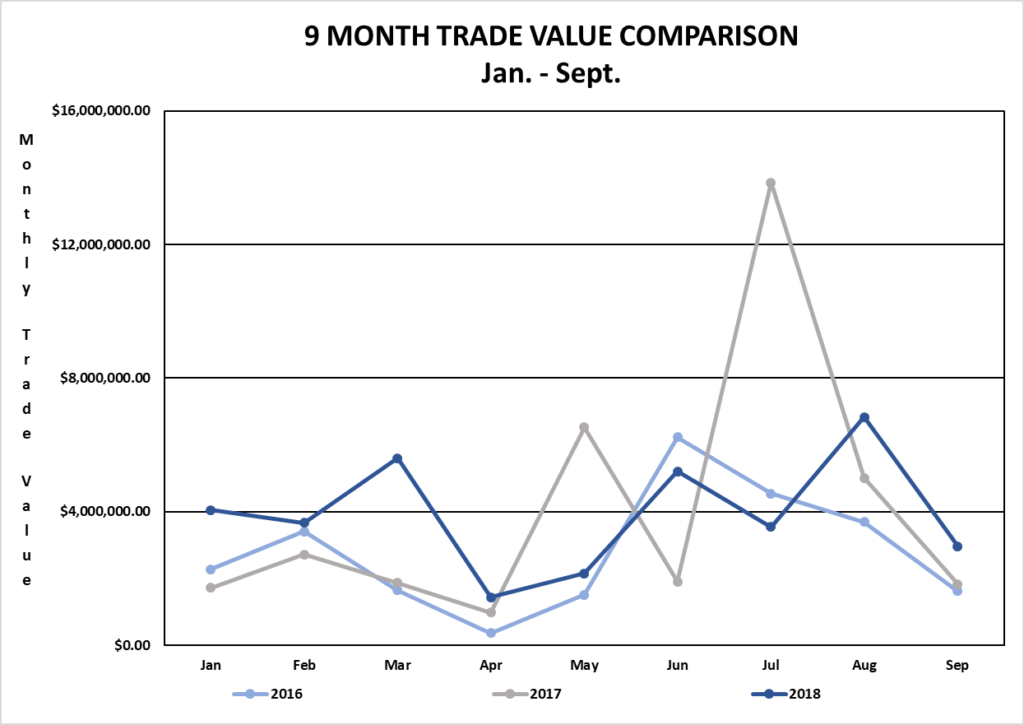
TRADING VOLUMES AND VALUES
Trading volume for the nine-month period January 2, 2018 to September 28, 2018 was 7,211,268 shares for a value of $35,480,614.86. By comparison, trading volume for the nine-month period January 1, 2017 to September 29, 2017 was 3,414,260 shares for a value of $36,445,020.43.
Trading volume for the three-month period July 1, 2018 to September 28, 2018 was 3,343,087 shares for a value of $13,346,815.61. By comparison, trading volume for the three-month period July 1, 2017 to September 29, 2017 was 1,063,957 shares for a value of $20,708,119.53.
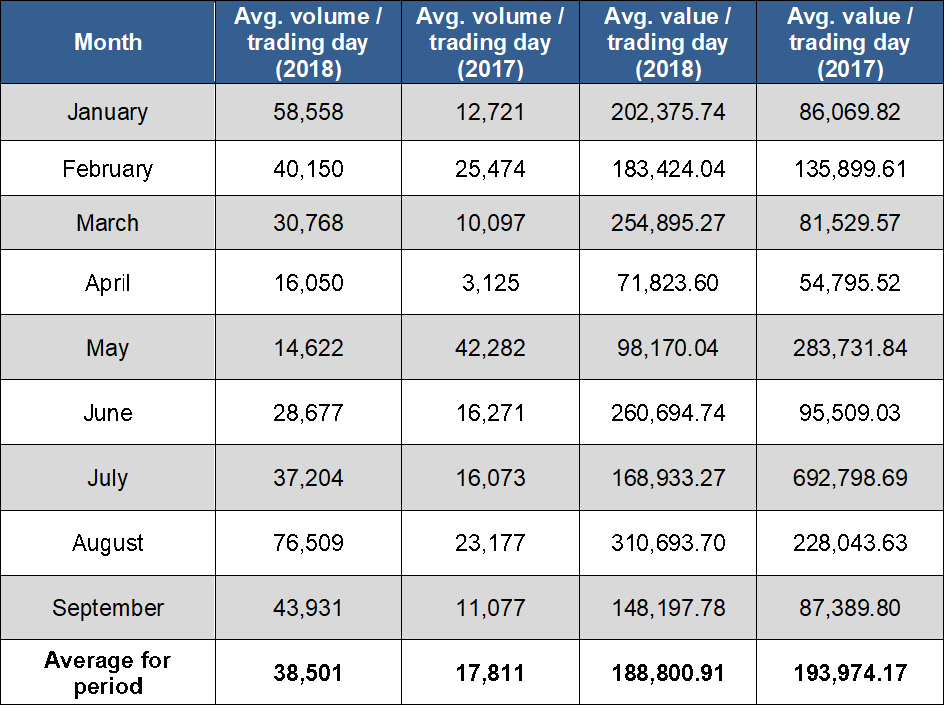
AVERAGE DAILY VOLUME AND VALUE
For the nine-month period from January 2, 2018 to September 28, 2018, the average volume per trading day was 38,501 shares for a value of $188,800.91. By comparison, for the nine-month period from January 1, 2017 to September 29, 2017, the average volume per trading day was 17,811 shares for an average value of $193,974.17.
SHARE VOLUME AND VALUE LEADERS (NINE MONTH PERIOD)
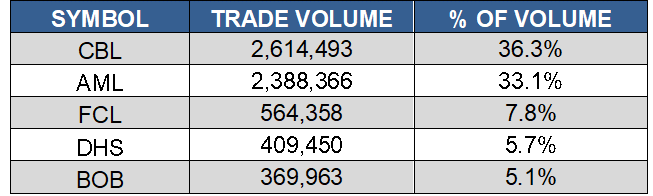
The top five share volume leaders on BISX for the nine-month period January 2, 2018 to September 28, 2018 with their contribution to total traded volume displayed as a percentage were:
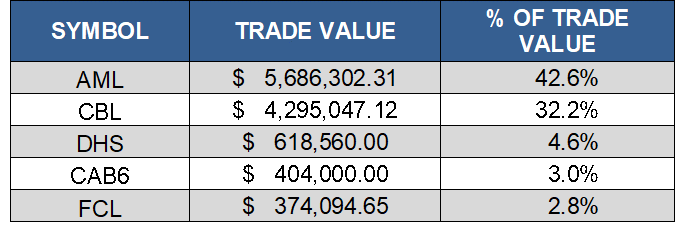
The top five share value leaders for the nine-month period January 2, 2018 to September 28, 2018 with their contribution to total traded value displayed as a percentage were:

SHARE VOLUME AND VALUE LEADERS (THREE MONTH PERIOD)
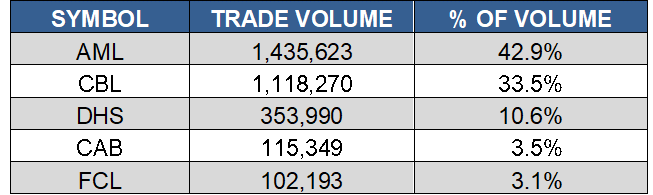
The top five share volume leaders on BISX for the three-month period July 1, 2018 to September 28, 2018 with their contribution to total traded volume displayed as a percentage were:
The top five share value leaders for the three-month period July 1, 2018 to September 28, 2018 with their contribution to total traded value displayed as a percentage were: