BISX Quarterly Statistical Report Q1 2021
FOR IMMEDIATE PUBLICATION
JANUARY TO MARCH 2021 STATISTICAL REPORT
BISX is pleased to announce its BISX All-Share Index and trading statistics for the three-month period ending March 31, 2021 with comparison to the same period of 2020.
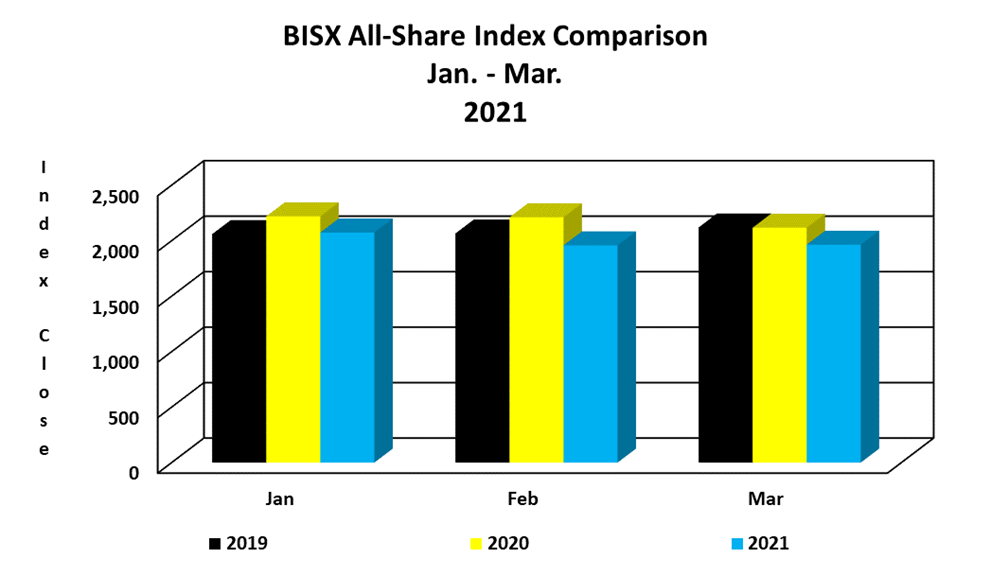
BISX ALL SHARE INDEX
For the three-month period ending March 31, 2021 the BISX All-Share Index closed at 1,963.78. This represents a year to date decrease of 128.54 or 6.14%. By comparison for the three-month period ending March 29, 2020 the BISX All-Share Index closed at 2,117.17. That was a year to date decrease of 114.33 or 5.13%. The BISX All-Share Index is a market capitalization weighted index comprised of all primary market listings excluding debt securities.
As at March 31, 2021 the market was comprised of 20 ordinary shares with a market capitalization of $4.52 Billion. In addition, there were 8 preference shares with a market capitalization of $249 million, 11 BGS and Corporate Bonds with a face value of $470 Million and 202 BGRS with a face value of 3.3 Billion.
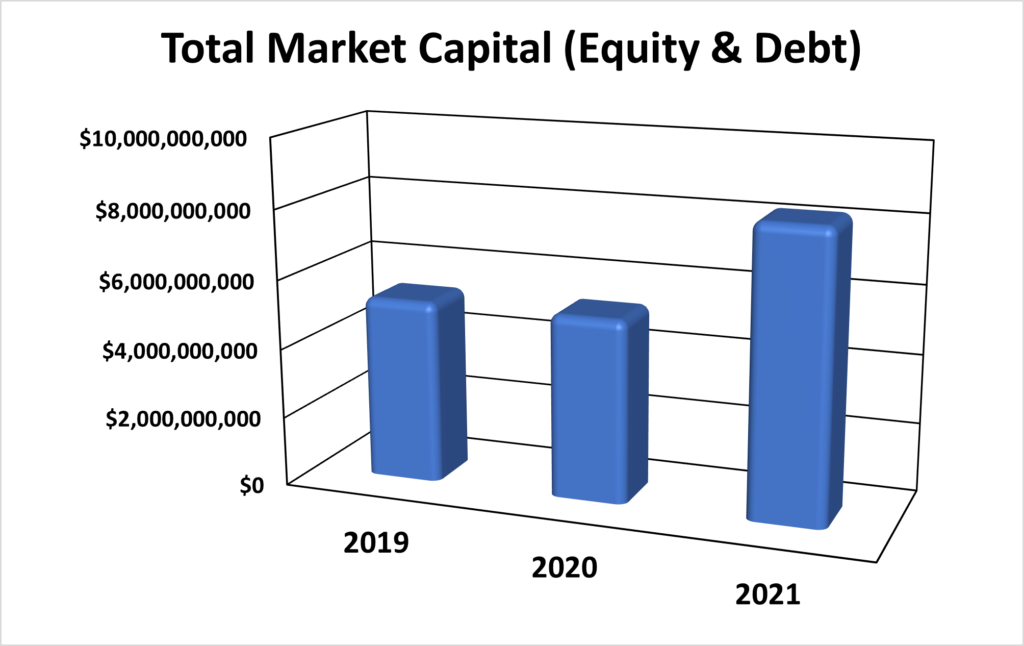
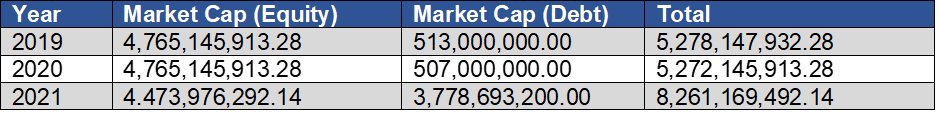
MARKET CAPITAL
Over the 3-year period 2019 to 2021, the market value of all securities listed on BISX has shown a decrease from 2019 to 2020 and an increase from 2020 to 2021, as indicated by the chart below (N.B the numbers in the chart and table are as at the end of Q1 for 2019, 2020 and 2021):
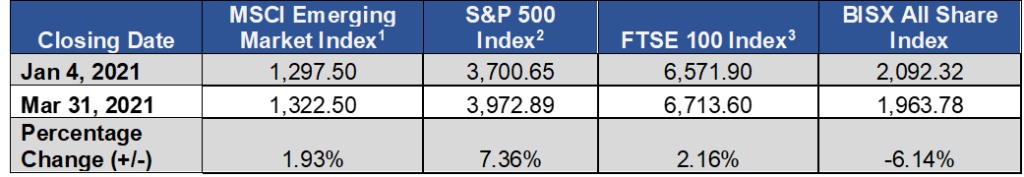
COMPARISON OF BISX ALL SHARE INDEX TO INTERNATIONAL INDICES
Over the three-month period January 4 to March 31, 2021, some international equity markets have experienced decreases as indicated by the chart below:
TOTAL TRADES BY SECURITY CLASS
For the three-month period ending March 31, 2021, the trade volumes and value of the various types of securities listed on BISX are detailed below:
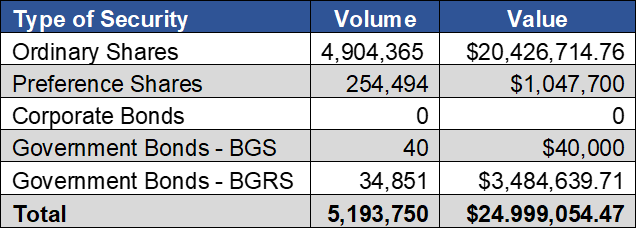
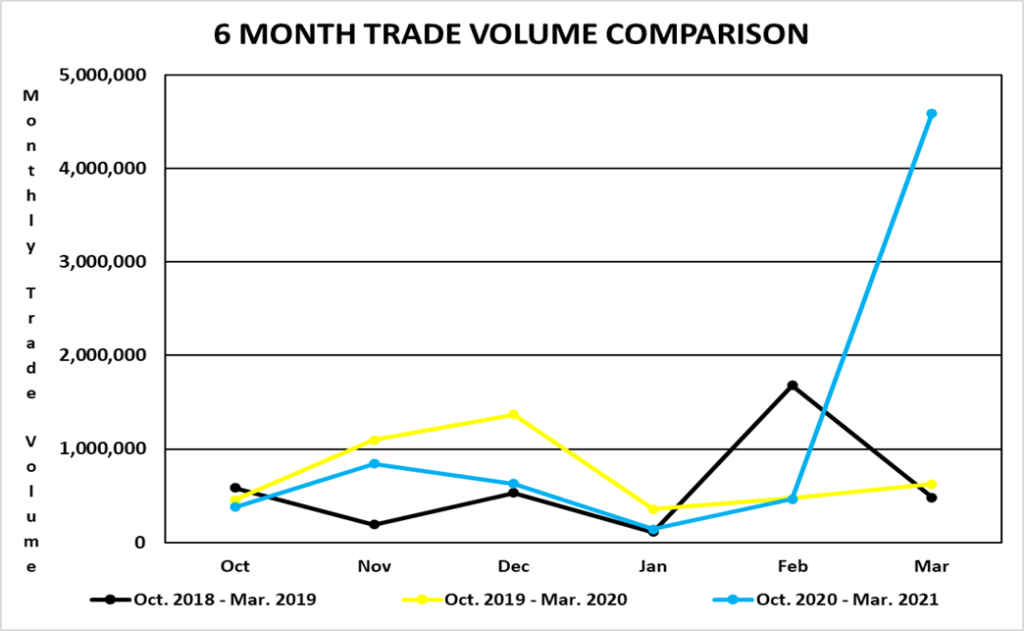
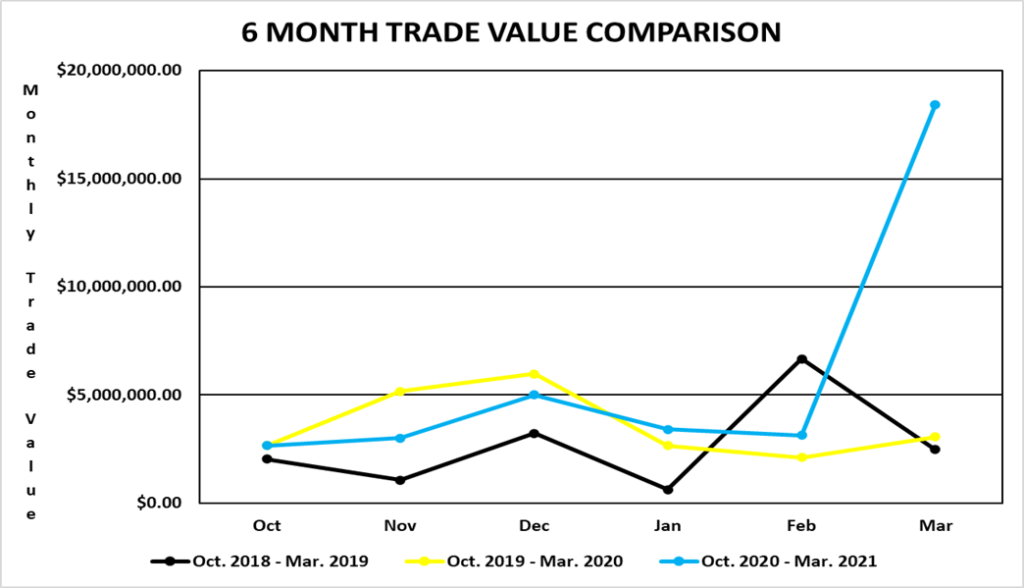
TRADING VOLUMES AND VALUES
Trading volume for the three-month period January 2, 2021 to March 31, 2021 was 5,193,750 shares for a value of $ 24,999,054.47. By comparison, trading volume for the three-month period January 2, 2020 to March 29, 2020 was 1,450,402 shares for a value of $7,859,910.56.
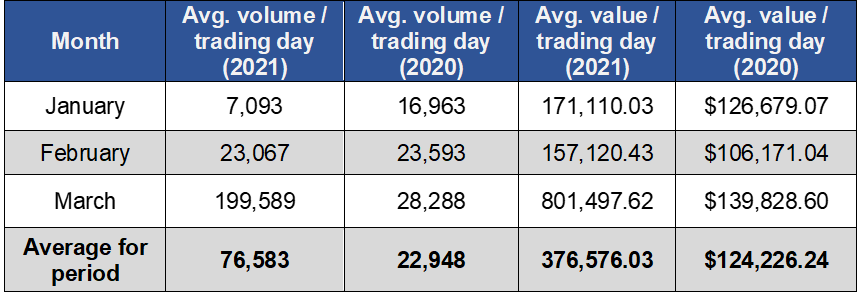
AVERAGE DAILY VOLUME AND VALUE
For the three-month period from January 2, 2021 to March 31, 2021, the average volume per trading day was 76,583 shares for a value of $376,576.03. By comparison, for the three-month period from January 2, 2020 to March 31, 2020, the average volume per trading day was 22,948 shares for a value of $124,226.24.
SHARE VOLUME AND VALUE LEADERS (THREE MONTH PERIOD)
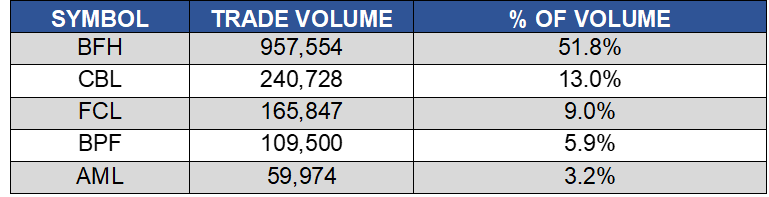
The top five share volume leaders on BISX for the three-month period January 2, 2021 to March 31, 2021 with their contribution to total traded volume displayed as a percentage were:
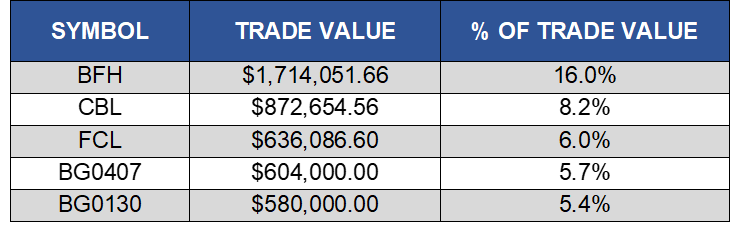
The top five share value leaders for the three-month period January 2, 2021 to March 31, 2021 with their contribution to total traded value displayed as a percentage were:
BISX Quarterly Statistical Report Q4 2020
FOR IMMEDIATE PUBLICATION
JANUARY TO DECEMBER 2020 STATISTICAL REPORT
BISX is pleased to announce its BISX All-Share Index and trading statistics for the twelve-month period ending December 31, 2020 with comparison to the same period of 2019.
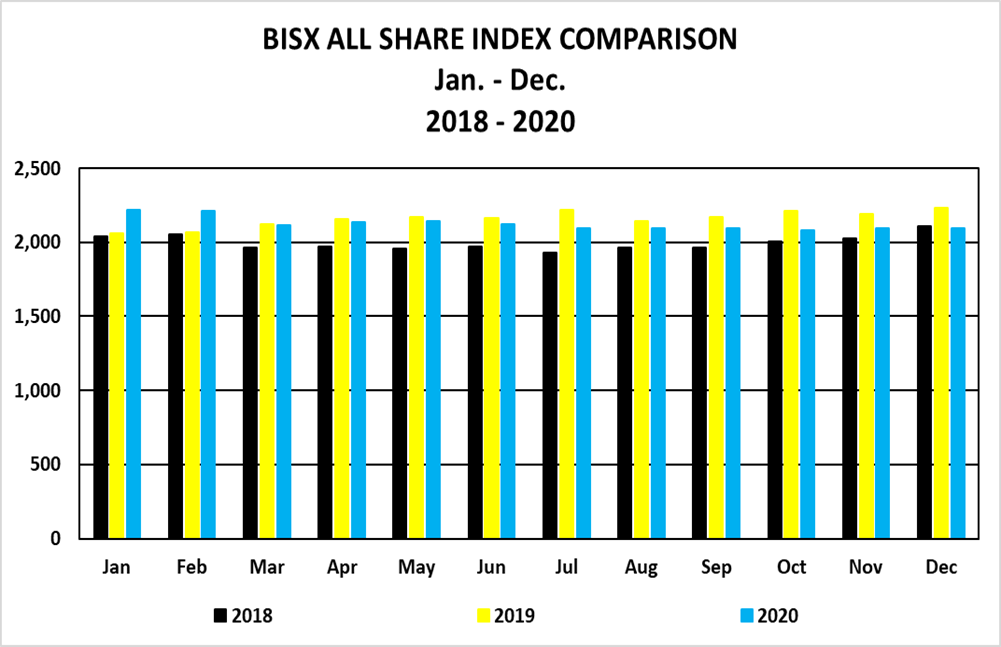
BISX ALL SHARE INDEX
For the twelve-month period ending December 31, 2020 the BISX All-Share Index closed at 2092.46. This represents a year to date decrease of 139.14 or 6.23%. By comparison for the twelve-month period ending December 31, 2019 the BISX All-Share Index closed at 2231.60. That increase was a year to date increase of 122.19 or 5.79%. The BISX All-Share Index is a market capitalization weighted index comprised of all primary market listings excluding debt securities.
As at December 31, 2020 the market was comprised of 20 ordinary shares with a market capitalization of $4.51 Billion. In addition, there were 7 preference shares with a market capitalization of $244 Million, 10 BGS and corporate bonds with a face value of $479 Million, and 210 BRS with a face value of $3.5 billion.
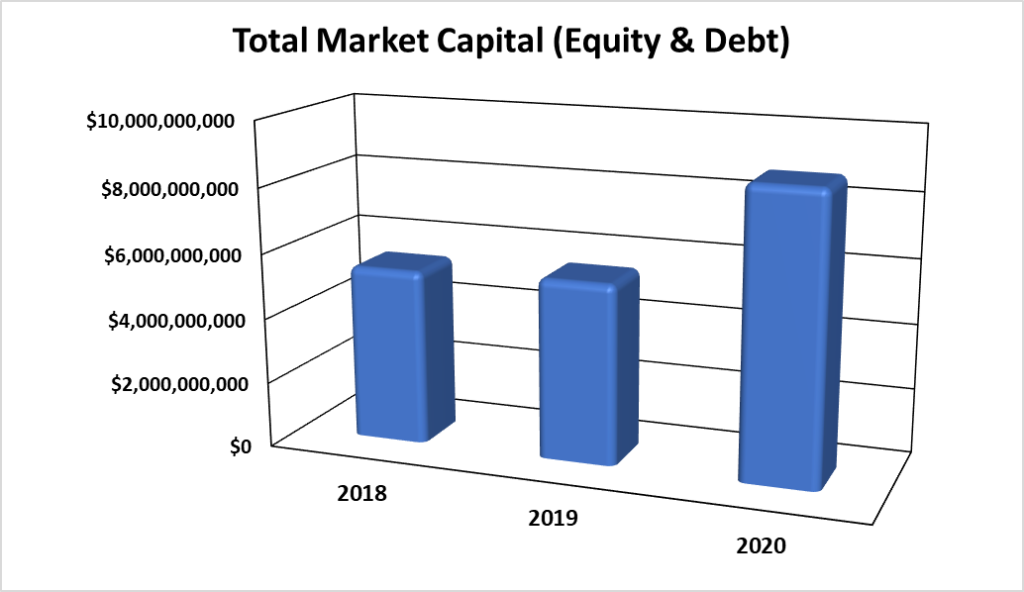
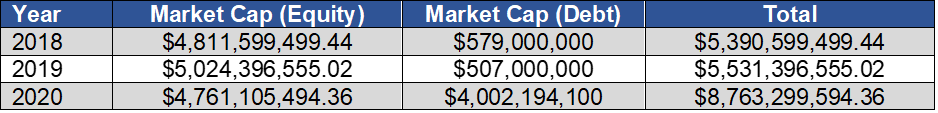
MARKET CAPITAL
Over the 3-year period 2018 to 2020, the market value of all securities listed on BISX has shown an increase from 2018 to 2019. The increase from 2019 – 2020 was due to the listing of BRS on BISX in July 2020; as indicated by the chart below:
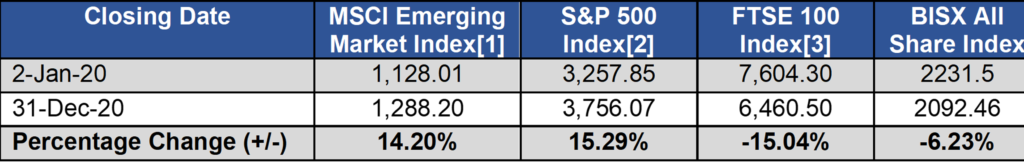
COMPARISON OF BISX ALL SHARE INDEX TO INTERNATIONAL INDICES
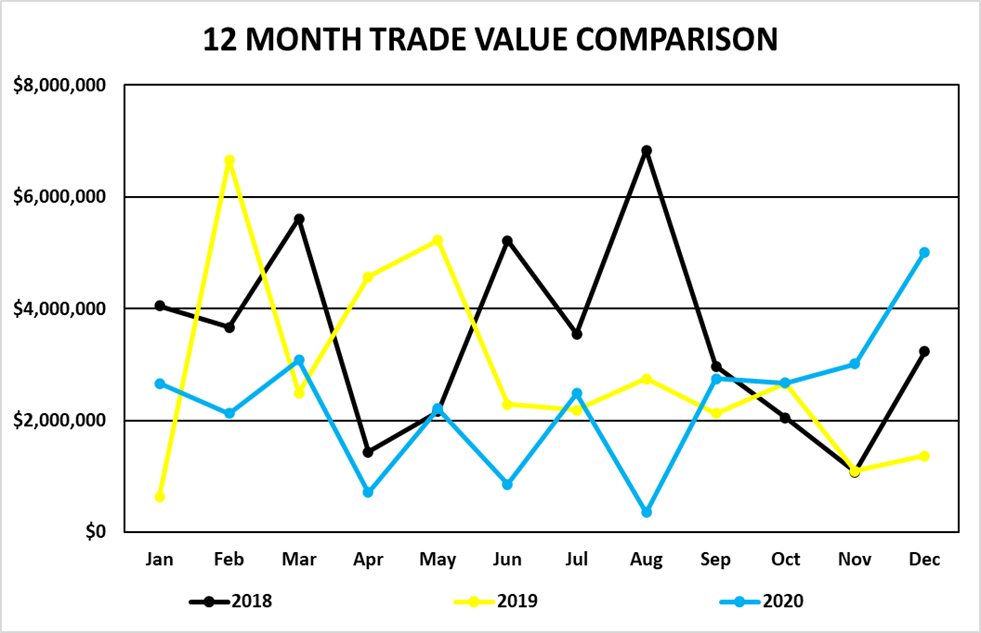
Over the 12-month period January 2 to December 31, 2020, some international equity markets have experienced increases and decreases as indicated by the chart below:
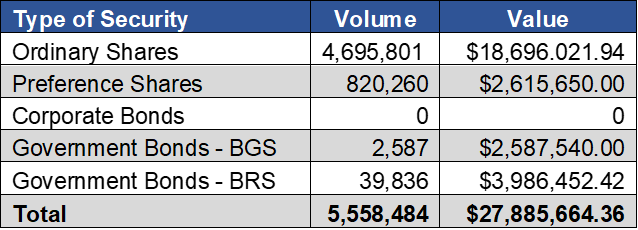
TOTAL TRADES BY SECURITY CLASS
For the twelve-month period ending December 31, 2020, each type of security produced the totals in the chart below.
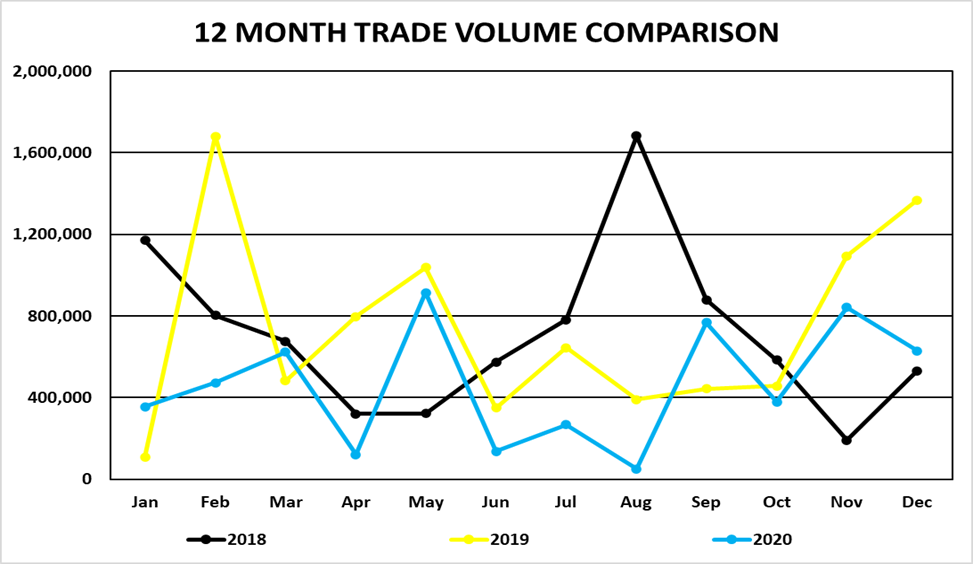
TRADING VOLUMES AND VALUES
Trading volume for the twelve-month period January 2, 2020 to December 31, 2020 was 5,558,484 shares for a value of $27,885,664.36. Trading volume for the twelve-month period January 2, 2019 to December 31, 2019 was 8,853,345 shares for a value of $42,745,590.47.
Trading volume for the three-month period October 1 to December 31, 2020 was 1,850,180 shares for a value of $10,688,918. By comparison, for the three-month period from October 1 to December 31, 2019 was 2,919,089 shares for a value of $13,818,345.31.
AVERAGE DAILY VOLUME AND VALUE
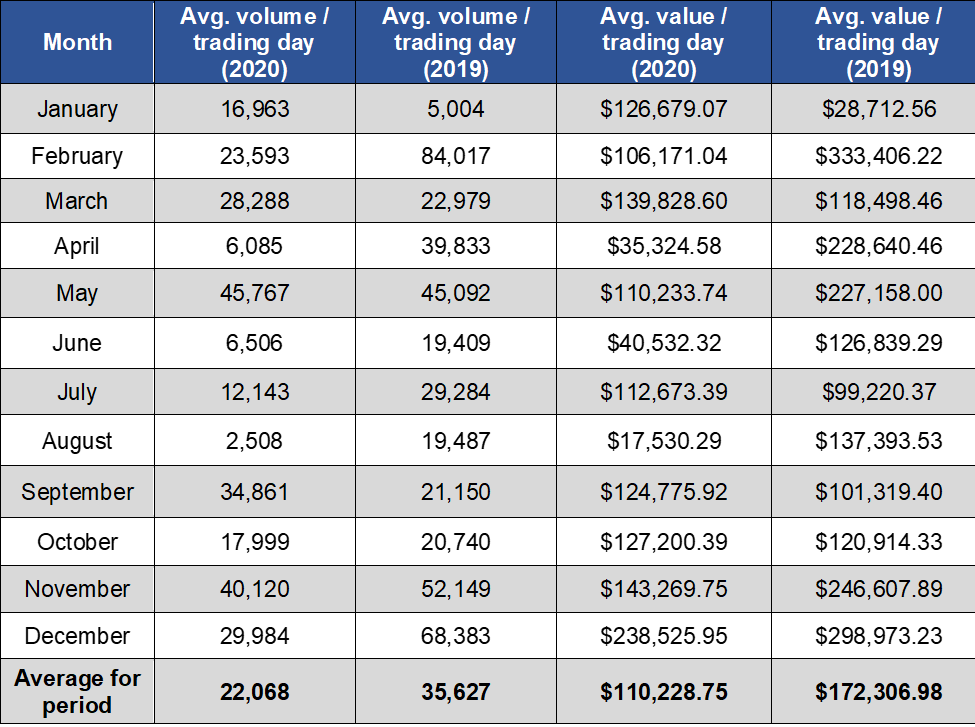
For the twelve-month period ending December 31, 2020, the average daily trading volume was 22,068 shares which resulted in an average daily trading value of $110,228.75. By comparison for the twelve-month period December 31, 2019 the average daily trading volume was 35,627 shares for an average value of $172,306.98.
During the three-month period from October 1, 2020 to December 31, 2020, the average volume per trading day was 29,368 shares for a value of $169,665.37. By comparison, for the three-month period from October 1, 2019 to December 31, 2019, the average volume per trading day was 47,091 shares for an average value of $222,165.15.
SHARE VOLUME AND VALUE LEADERS (TWELVE MONTH PERIOD)
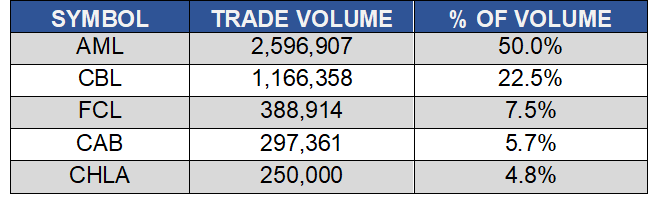
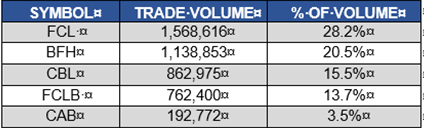
The top five share volume leaders on BISX for the twelve-month period January 2, 2020 to December 31, 2020 with their contribution to total traded volume displayed as a percentage were:
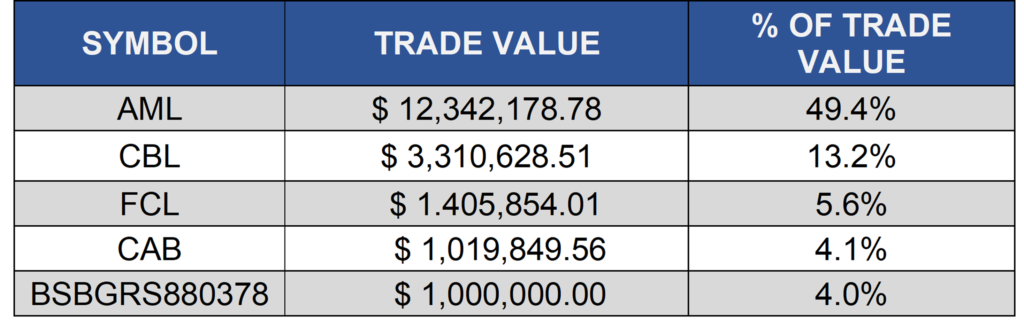
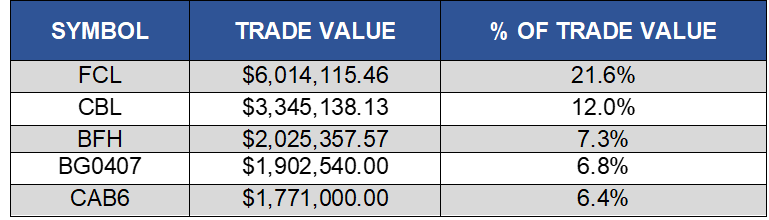
The top five share value leaders for the twelve-month period January 2, 2020 to December 31, 2020 with their contribution to total traded value displayed as a percentage were:
SHARE VOLUME AND VALUE LEADERS (THREE MONTH PERIOD)
The top five share volume leaders on BISX for the three-month period October 1, 2020 to December 31, 2020 with their contribution to total traded volume displayed as a percentage were:
The top five share value leaders for the three-month period October 1, 2019 to December 31, 2019 with their contribution to total traded value displayed as a percentage were:
- « Previous Page
- 1
- 2
- 3
- 4
- 5
- …
- 25
- Next Page »